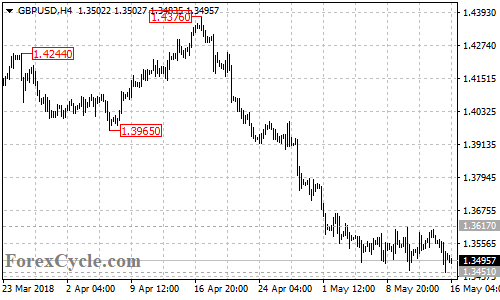
GBPUSD moved sideways in a trading range between 1.3451 and 1.3617. As long as 1.3617 key resistance holds, the sideways movement could be treated as consolidation for the downtrend from 1.4376 and further decline towards 1.3350 is still possible after the consolidation. Only a breakout of 1.3617 resistance could signal completion of the downtrend.