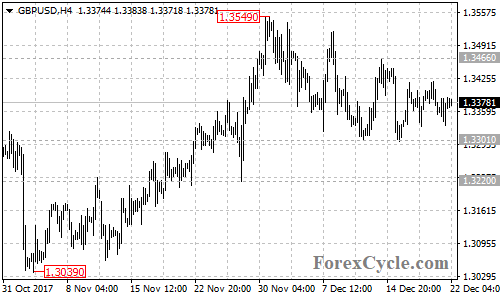
GBPUSD moved sideways in a range between 1.3301 and 1.3466 for several days. Key resistance is at 1.3466. As long as this level holds, the price action in the range could be treated as consolidation of the downtrend from 1.3549, and a breakdown below 1.3301 could take price to test 1.3220 support. Below this level would aim 1.3027 (Oct 6 low) support. On the upside, a breakout of 1.3466 resistance could signal completion of the downtrend from 1.3549, then the following upside movement could take price to next resistance level at 1.3549, followed by 1.3657 (Sep 20 high).