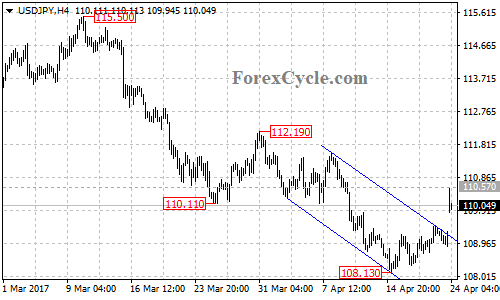
USDJPY broke above the top of the descending price channel on 4-hour chart, indicating that the downward movement from 112.19 had completed at 108.13 already. However, the bounce from 108.13 would possibly be consolidation of the longer term downtrend from 115.50. Range trading between 108.13 and 110.57 would likely be seen over the next several days. Resistance is at 110.57, only break above this level will confirm that the downtrend from 115.50 is complete, then the following upward movement could bring price to 113.00 zone.


