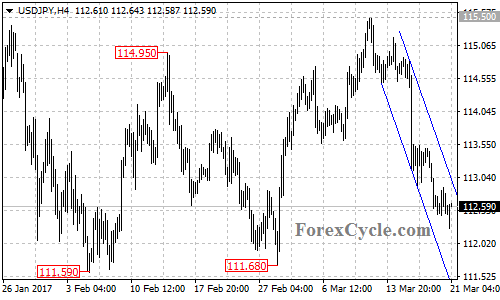
USDJPY continued its downward movement from 115.50 and the fall extended to as low as 112.26. Resistance is located at the top of the price channel on 4-hours chart. As long as the channel resistance holds, the downtrend could be expected to continue and further decline to test 111.59 support is possible. On the upside, a clear break above the channel resistance will indicate that the downtrend is complete, then another rise to test 115.60 resistance could be seen.