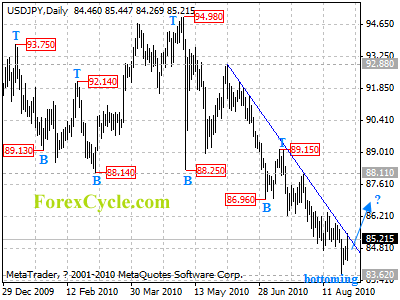
USDJPY may be forming a cycle bottom at 83.62 level on daily chart. Key resistance is at the falling trend line from 92.88 to 88.11, a clear break above the trend line resistance will confirm the cycle bottom, then further rally could be seen to 87.00-88.00 area. Support is at 83.62, only break below this level could trigger another fall to 82.00 zone.
For long term analysis, USDJPY has formed a cycle top at 94.98 level on weekly chart. Drop to 80.00 is still possible after consolidation.


