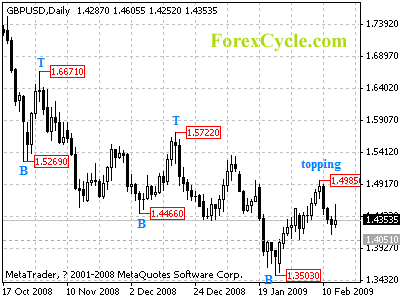
GBPUSD is forming a cycle top at 1.4985 on daily chart. Key support is located at 1.4051, a break below this level will confirm the cycle top, and then sideways consolidation in a range between 1.3503 and 1.4985 could be seen to follow.
For long term analysis, GBPUSD remains in long term bearish movement. Further fall towards 1.3000 to reach the next cycle bottom on weekly chart could be expected.


