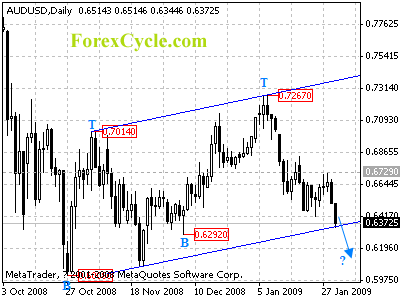
AUDUSD is testing the support of the lower border of the price channel on daily chart. The fall from 0.7267 could possibly be resumption of the long term downtrend from 0.9849 (July 15, 2008 high). A break below the channel support will signal deeper decline to test 0.6008 (Oct 27, 2008 low) support. Key resistance is now located at 0.6729, only rise above this level will indicate that the fall from 0.7267 has completed.
For long term analysis, AUDUSD formed a cycle bottom at 0.6008 level on weekly chart. Consolidation in a range between 0.6008 and 0.7500 is possible in next several weeks.


