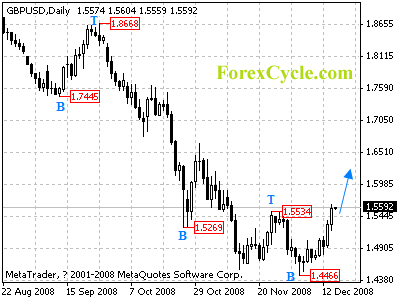
GBPUSD breaks above 1.5534 key resistance, suggesting that the down trend from 2.0158 (July 15 high) has completed, and a cycle bottom has been formed at 1.4466 on daily chart. Further rally could be seen to 1.6500 zone in a couple of weeks. Near term support is now located at 1.4466, only fall below this level will signal resumption of the long term down trend.
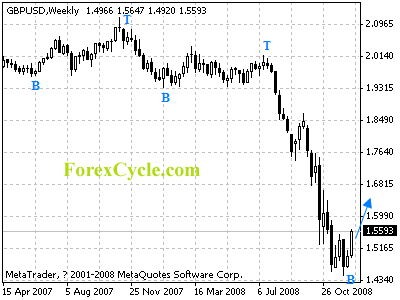
For long term analysis, GBPUSD formed a cycle bottom at 1.4466 on weekly chart, and is now in consolidation of long term down trend. Rebound towards 1.7000 zone is expected.


