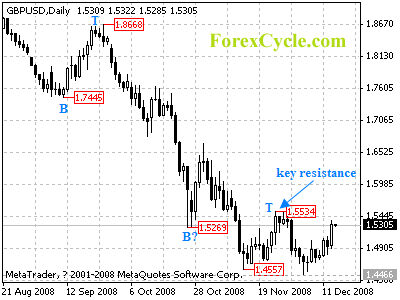
GBPUSD is testing 1.5534 key resistance, a break above this level will indicate that a cycle bottom has been formed at 1.4466 on daily chart, and signify that the long term down trend from 2.0158 (July 15 high) has completed. However, as long as 1.5534 resistance holds, we’d expect down trend to resume, and one more fall towards 1.4000 is still possible.
For long term analysis, GBPUSD remains in long term bearish movement. Deeper decline to 1.4000 zone to reach the next cycle bottom on weekly chart is still possible.


