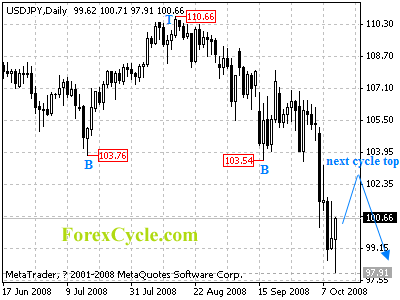
USDJPY’s down trend from 110.66 extends to 97.91 level. Rebound towards 103.00 zone could be seen to reach next cycle top on daily chart next week. However, the rise from 97.91 is treated as consolidation to down trend, deeper decline is still possible to test 95.77 (Mar 17 low) long term support.
For long term analysis, USDJPY formed a cycle top at 110.66 on weekly chart. Pullback towards 95.77 (Mar 17 low) to reach next cycle bottom is now in favor. In a bigger picture, the pair formed a long term cycle bottom at 95.77 on monthly chart and is in long term bullish movement. Further rise towards 120.00 is still possible after testing 95.77 level.


