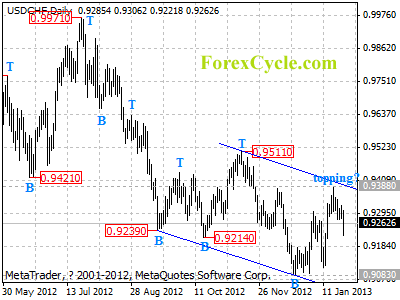
Being contained by the resistance of the upper line of the price channel on daily chart, USDCHF pulls back from 0.9388, suggesting that that a cycle top is being formed. Further decline to test 0.9083 previous low support would likely be seen next week, a breakdown below this level will indicate that the downtrend from 0.9971 has resumed. On the upside, a clear break above the channel resistance will suggest that lengthier consolidation of the downtrend from 0.9971 is underway, then further rise to 0.9500 area is possible.
For long term analysis, USDCHF had formed a cycle top at 0.9971 on weekly chart. Further decline to 0.8500 area would likely be seen over the next several months.