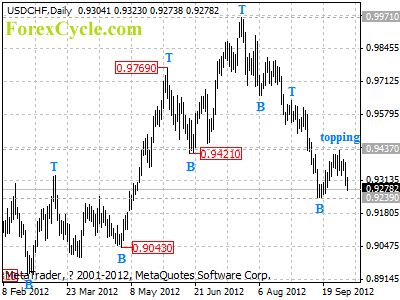
USDCHF may be forming a cycle top at 0.9437 on daily chart. Initial support is at 0.9239, a breakdown below this level could signal resumption of the downtrend from 0.9971, then further decline to 0.9000 area could be seen. Resistance is at 0.9437, only break above this level will indicate that lengthier consolidation of the downtrend is underway.
For long term analysis, USDCHF had formed a cycle top at 0.9971 on weekly chart. Further decline to 0.8500 area would likely be seen over the next several weeks.

