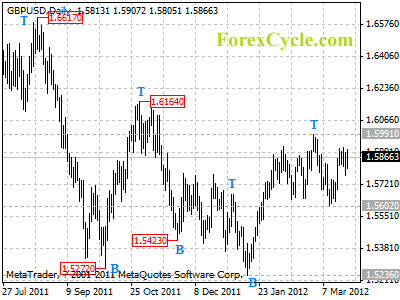
GBPUSD formed a cycle bottom at 1.5602 on daily chart. Further rise to test 1.5991 previous high resistance would likely be seen next week as long the this level holds, the rise from 1.5602 would possibly be correction of the downtrend from 1.5991, and another fall towards 1.5000 is still possible. On the other side, a break above 1.5991 will indicate that the uptrend from 1.5236 has resume, then further rise to 1.6300 could be seen.
For long term analysis, GBPUSD may be forming a cycle top at 1.5991 on weekly chart, key support is at 1.5602, a breakdown below this level will confirm the cycle top, then further fall towards 1.4500 could be seen over the next several months.