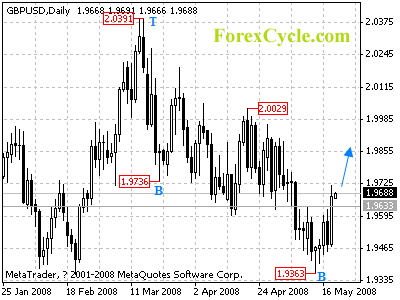
GBPUSD broke above 1.9633 key resistance and formed a cycle bottom at 1.9363 on daily chart. The pair is back to range trading between 1.9337 (Jan 22 low) and 2.0391. Further rally is expected to test 2.0029 resistance. Key support is now located at 1.9363, only break of this level will signal resumption of the down trend.
For long term analysis, the pair is in long term bearish movement. The rise from 1.9337 (Jan 22 low) is treated as correction to the long term down trend. Further fall towards 1.9200 area to reach the next long term cycle bottom on weekly chart is still possible.

