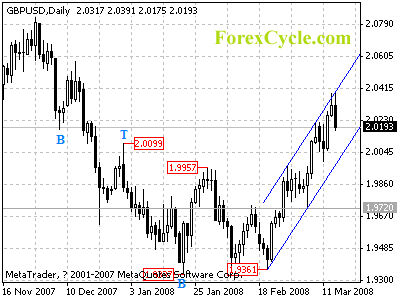
GBPUSD’s up trend remains and the rise from 1.9361 extends to as high as 2.0391. As long as the rising price channel support holds, rise to 2.0500 to reach the next cycle top on daily chart is still possible. Key support is at 1.9720, a break down of this support will confirm the cycle top and indicates that the correction to the down trend from 1.9337 has completed, and then, further fall below 1.9337 is expected to follow.
For long term analysis, the pair is in long term bearish movement. The rise from 1.9337 is treated as correction to the long term down trend. Further fall towards 1.8000 area to reach the next long term cycle bottom on weekly chart is still possible after correction.