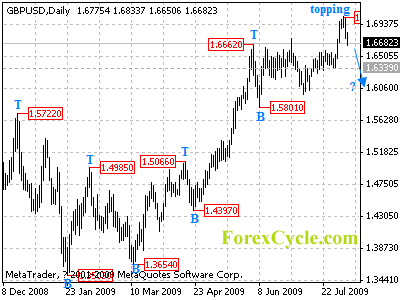
GBPUSD is forming a cycle top at 1.7042 level on daily chart, key support is at 1.6339, a break below this level will confirm the cycle top, then deeper decline could be seen to 1.5900-1.6000 area. Long term key support is at 1.5801, below this level will indicate that the uptrend from 1.3503 has completed. Near term resistance is at 1.7042, only rise above this level will signal further rally to 1.7500 zone.
For long term analysis, GBPUSD is in correction of the long term downtrend from 2.1161 (2007 high). Rebound to 1.7000-1.7500 area to reach the next cycle top on weekly chart is still possible.