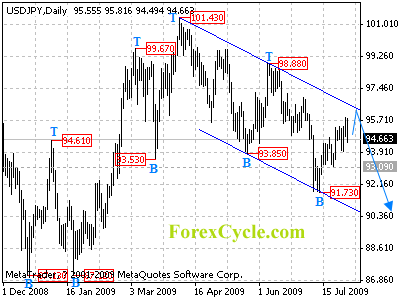
USDJPY is moving to the upper border of the falling price channel on daily chart. As the next cycle top is nearing, pullback would more likely be seen before breaking above the top of the price channel. Key support is now at 93.09, below this level will suggest that a cycle top has been formed on daily chart, then deeper decline below 91.73 previous low could be seen.
For long term analysis, USDJPY formed a cycle top at 101.43 level on weekly chart. Further fall to 89.00-90.00 to reach the next cycle bottom is expected in next several weeks.


