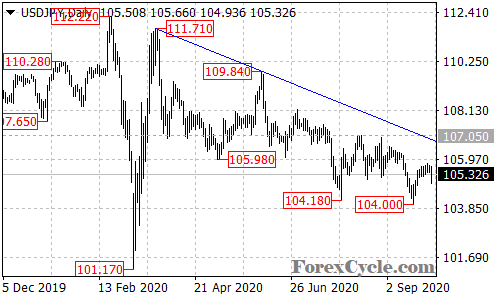
USDJPY moved sideways in a trading range between 104.00 and 107.05. As long as the price is below the falling trend line on the daily chart, the price action in the range could be treated as consolidation for the downtrend from 111.71, and further decline to 103.00 area is still possible. Key resistance is at 107.05, only break above this level could signal completion of the downtrend.