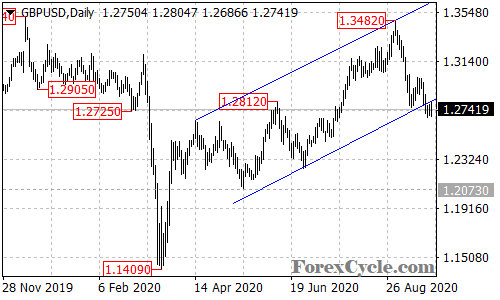
GBPUSD broke below the bottom of the rising price channel on the daily chart, suggesting that the upside movement from 1.1409 had completed at 1.3482 already. Deeper decline would likely be seen in the coming days and next target would be at 1.2200 area. Near term resistance is at 1.3100, only break above this level could trigger another rise towards 1.3500.