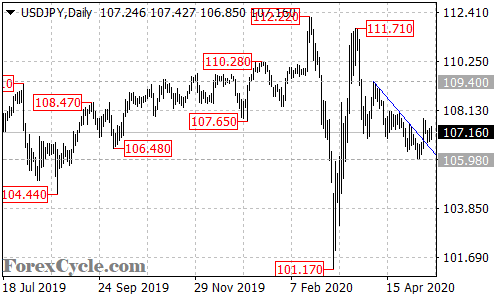
USDJPY broke above the falling trend line on the 4-hour chart, suggesting that the downside movement from 111.71 had completed at 105.98 already. Another rise towards 111.00 would likely be seen next week. Support is at 105.98, only break below this level could trigger another fall towards 103.00.