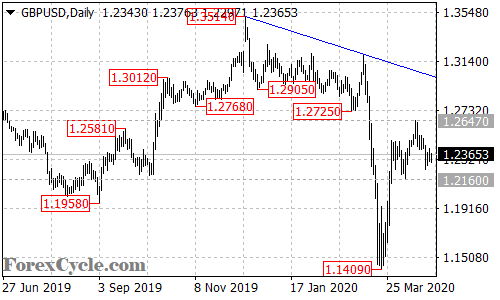
GBPUSD moved sideways in a trading range between 1.2160 and 1.2647. As long as 1.2160 support holds, the sideways movement could be treated as consolidation for the uptrend from 1.1409, and further rise towards the falling trend line on the daily chart is possible. On the downside, a breakdown below 1.2160 support would indicate that the upside movement had completed at 1.2647 already, then the pair would find next support level at around 1.1750.