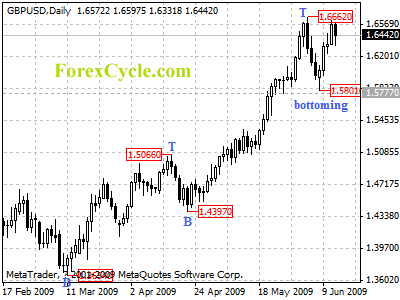
GBPUSD is forming a cycle bottom at 1.5801 on daily chart. Range trading between 1.5801 and 1.6662 is possible next week. Key resistance is located at 1.6662, a break above this level will indicate that the uptrend from 1.3654 has resumed and further rally could be seen to 1.7500 zone. However, below 1.5777 key support will suggest that the uptrend from 1.3654 has completed at 1.6662 level already.
For long term analysis, GBPUSD is in consolidation of the long term downtrend from 2.1161 (2007 high). Rebound to 1.6500-1.7000 area to reach the next cycle top on weekly chart is expected.


