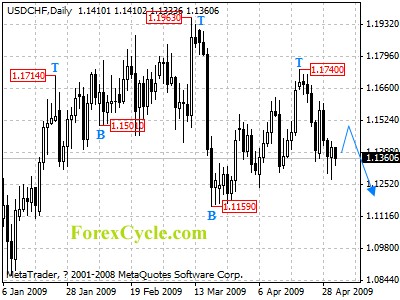
USDCHF formed a cycle top at 1.1740 level on daily chart. Deeper decline to test 1.1159 support is possible next week. A break below this level will indicate that the fall from 1.1740 is resumption of the downtrend from 1.1963, and then further fall towards 10800 could be seen to follow.
For long term analysis, USDCHF has formed a cycle bottom at 1.0366 level on weekly chart. Consolidation in a range between 1.0366 and 1.2296 is expected in a couple of months.