
Hello fellow traders. In this technical article we’re going to take a look at the Elliott Wave charts of USDJPY Forex pair published in members area of the website. As our members know USDJPY is in overall bullish trend. Recently the pair made a clear three-wave correction. The pull back completed right at the extreme area ( buyers zone) and made rally as we expected. In this discussion, we’ll break down the Elliott Wave forcast.
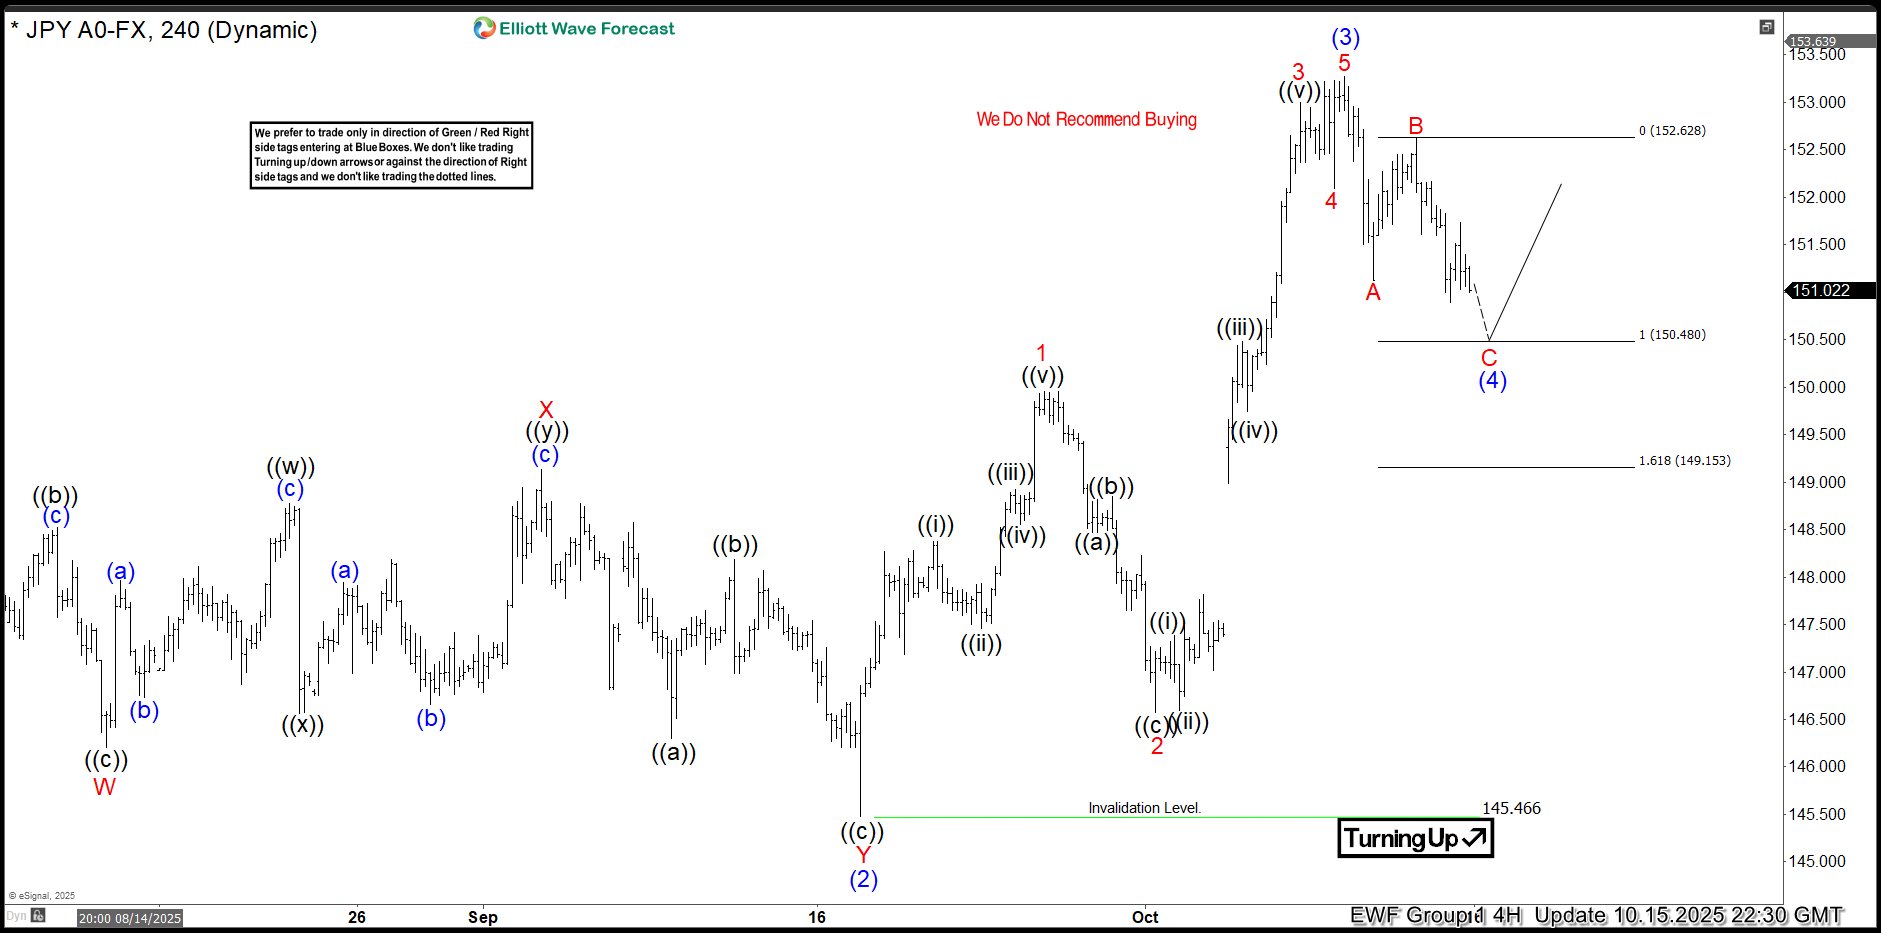
USDJPY Elliott Wave 4 Hour Chart 10.15.2025
USDJPY is forming a Zig Zag pullback. The correction shows incomplete sequences at the moment. We expect to see an extension down toward the marked equal legs zone at 150.48–149.15. In that area, buyers should appear again and take the lead. Ideally, we expect a rally toward new highs, or at least a 3-wave bounce as an alternative view. We advise against selling $USDJPY and instead favor the long side from the marked equal legs area at 150.48–149.15.
Did you know ? 90% of traders fail because they don’t understand market patterns. Are you in the top 10%? Test yourself with this advanced Elliott Wave Test
Official trading strategy on How to trade 3, 7, or 11 swing and equal leg is explained in details in Educational Video, available for members viewing inside the membership area.
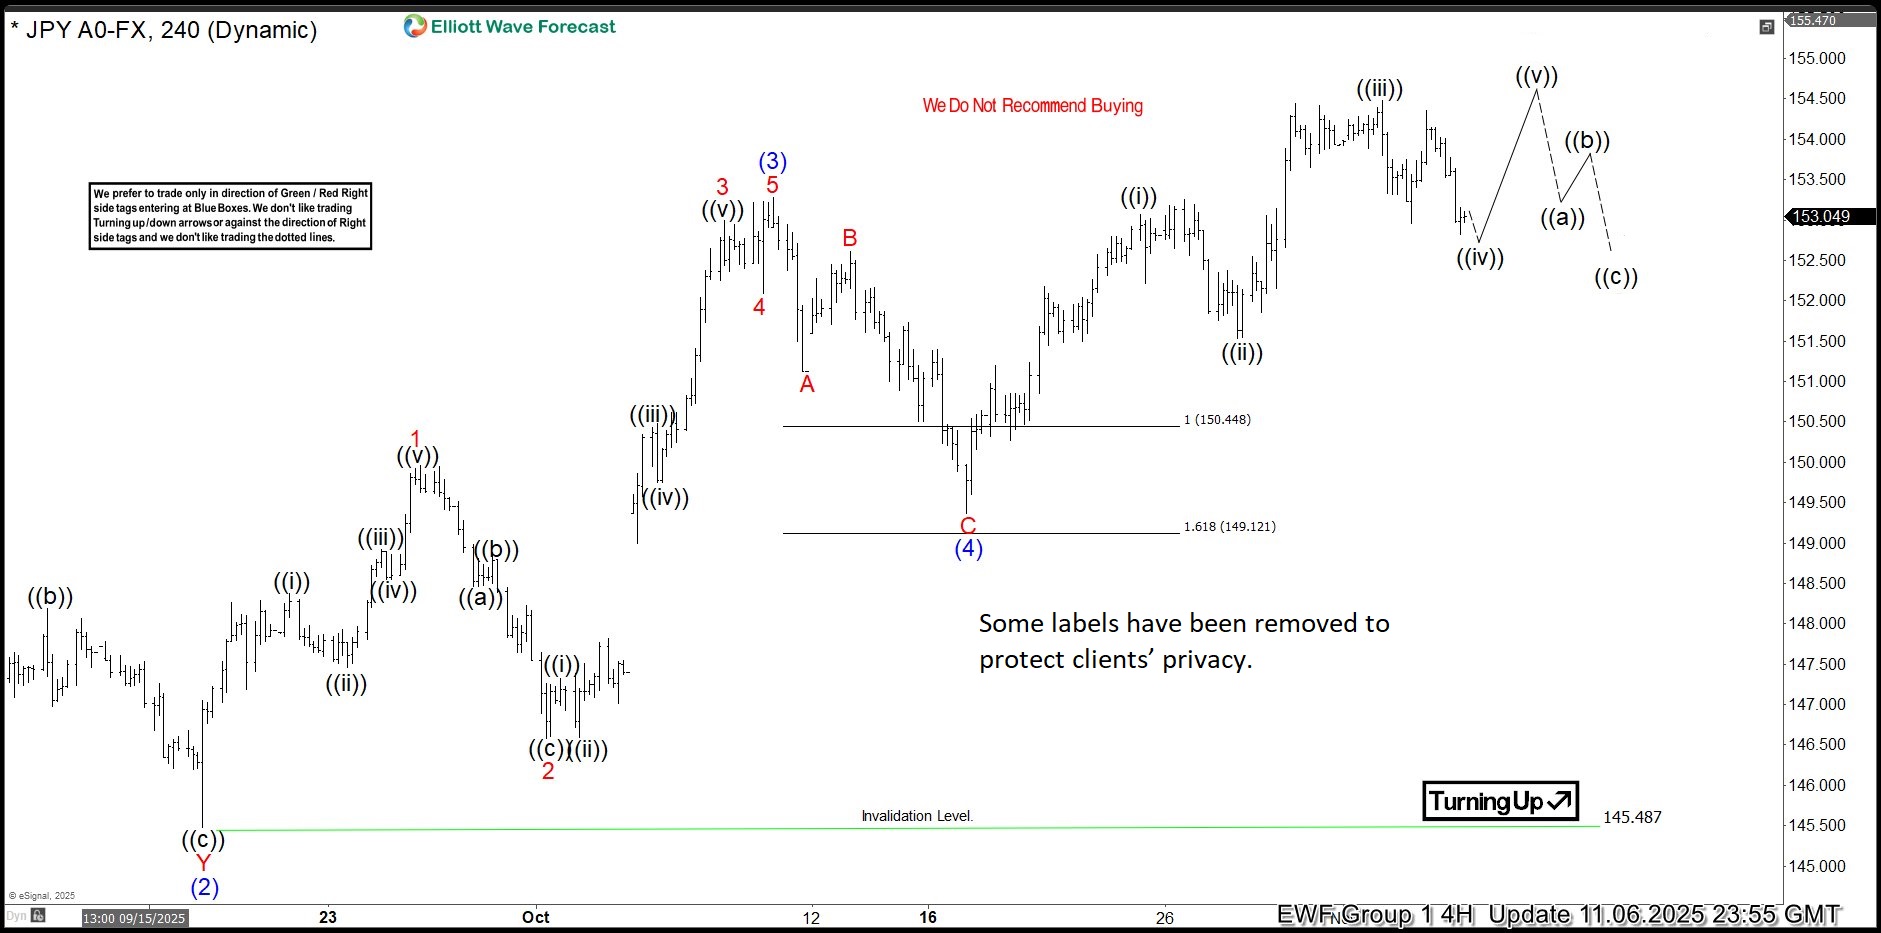
USDJPY Elliott Wave 4 Hour Chart 10.15.2025
USDJPY found buyers at the equal legs zone as expected. The forex pair has reacted strongly and eventually we got a break toward new highs.
Keep in mind that market is dynamic and presented view could have changed in the mean time.
Our chat rooms in the membership area are available 24 hours a day, providing expert insights on market trends and Elliott Wave analysis. Don’t hesitate to reach out with any questions about the market, Elliott Wave patterns, or technical analysis. We’re here to help.
Source: https://elliottwave-forecast.com/forex/usdjpy-elliott-wave-buyers-zone/