JPMorgan Chase (JPM) trades at $301.42, testing a breakout zone near its 52-week high. This level signals strong bullish momentum. The stock remains above its 50-day and 200-day moving averages by 3.39% and 15.00%, respectively. Investors continue to show confidence in JPM’s earnings and strategic direction. Despite macro uncertainty and policy shifts, the bank maintains upward strength.
Analysts remain bullish. The average price target sits at $302.93, suggesting limited upside. BofA Securities and Wells Fargo offer aggressive targets of $340 and $325. They cite JPM’s leadership in digital finance and AI integration. JPM also adapts well to regulatory changes. Although EPS dipped from $19.75 to $18.60, forecasts show a rebound to $19.82 next year.
JPMorgan Research expects strong U.S. growth and dollar resilience. These trends support financials like JPM. The firm’s broad exposure consumer banking, investment services, and fintech—offers strategic advantages. The Chase is well-positioned to benefit from AI adoption and global trade shifts.
Elliott Wave Outlook: JPM Weekly Charts September 2024
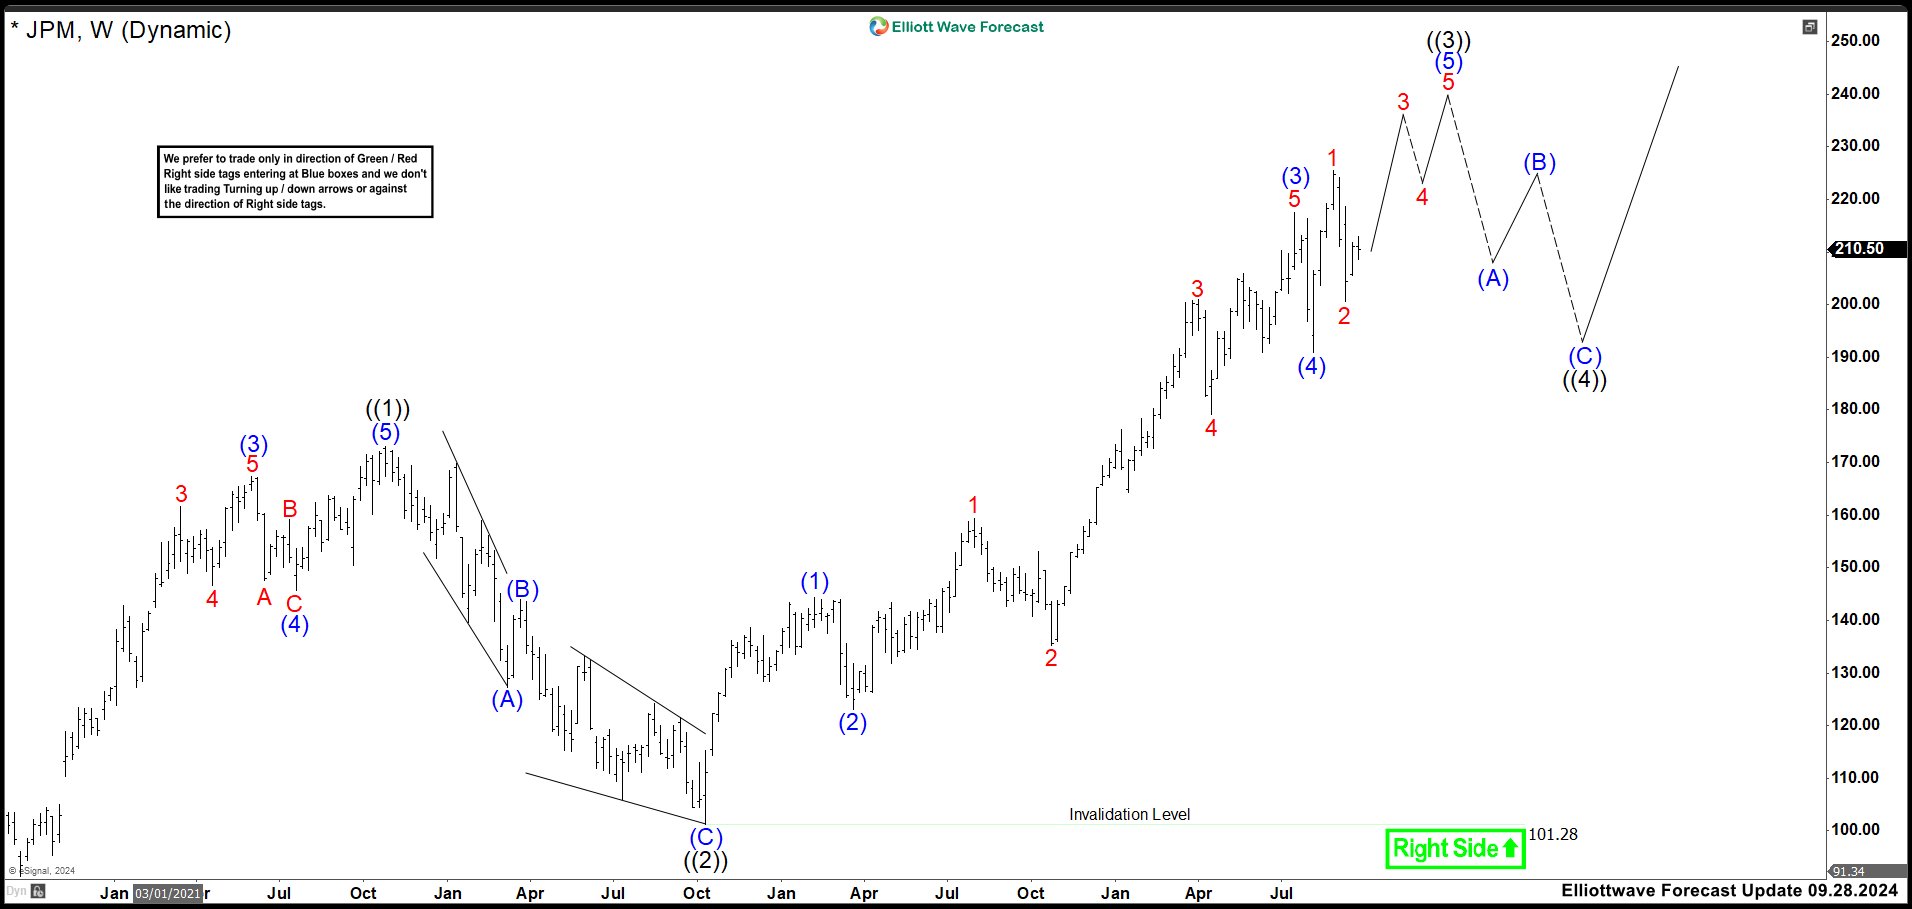
In 2024, we viewed the weekly Elliott Wave structure as a clear impulsive sequence from the March 2020 low. Wave ((1)) peaked at 172.28, then wave ((2)) corrected to 101.28. From there, price began wave ((3)), which remained incomplete. We projected wave ((3)) to end between 234 and 241. If no further extension developed, we expected sellers to emerge in that zone. This would likely trigger wave ((4))—a corrective phase before the next bullish leg. This is the last article: JPMorgan (JPM) Is Not Showing Weakness Near Term
If you’re eager to dive deeper into Elliott Wave Theory and learn how its principles apply to market forecasting, you might find these resources helpful: Elliott Wave Education and Elliott Wave Theory.
Elliott Wave Outlook: JPM Weekly Charts August 2025
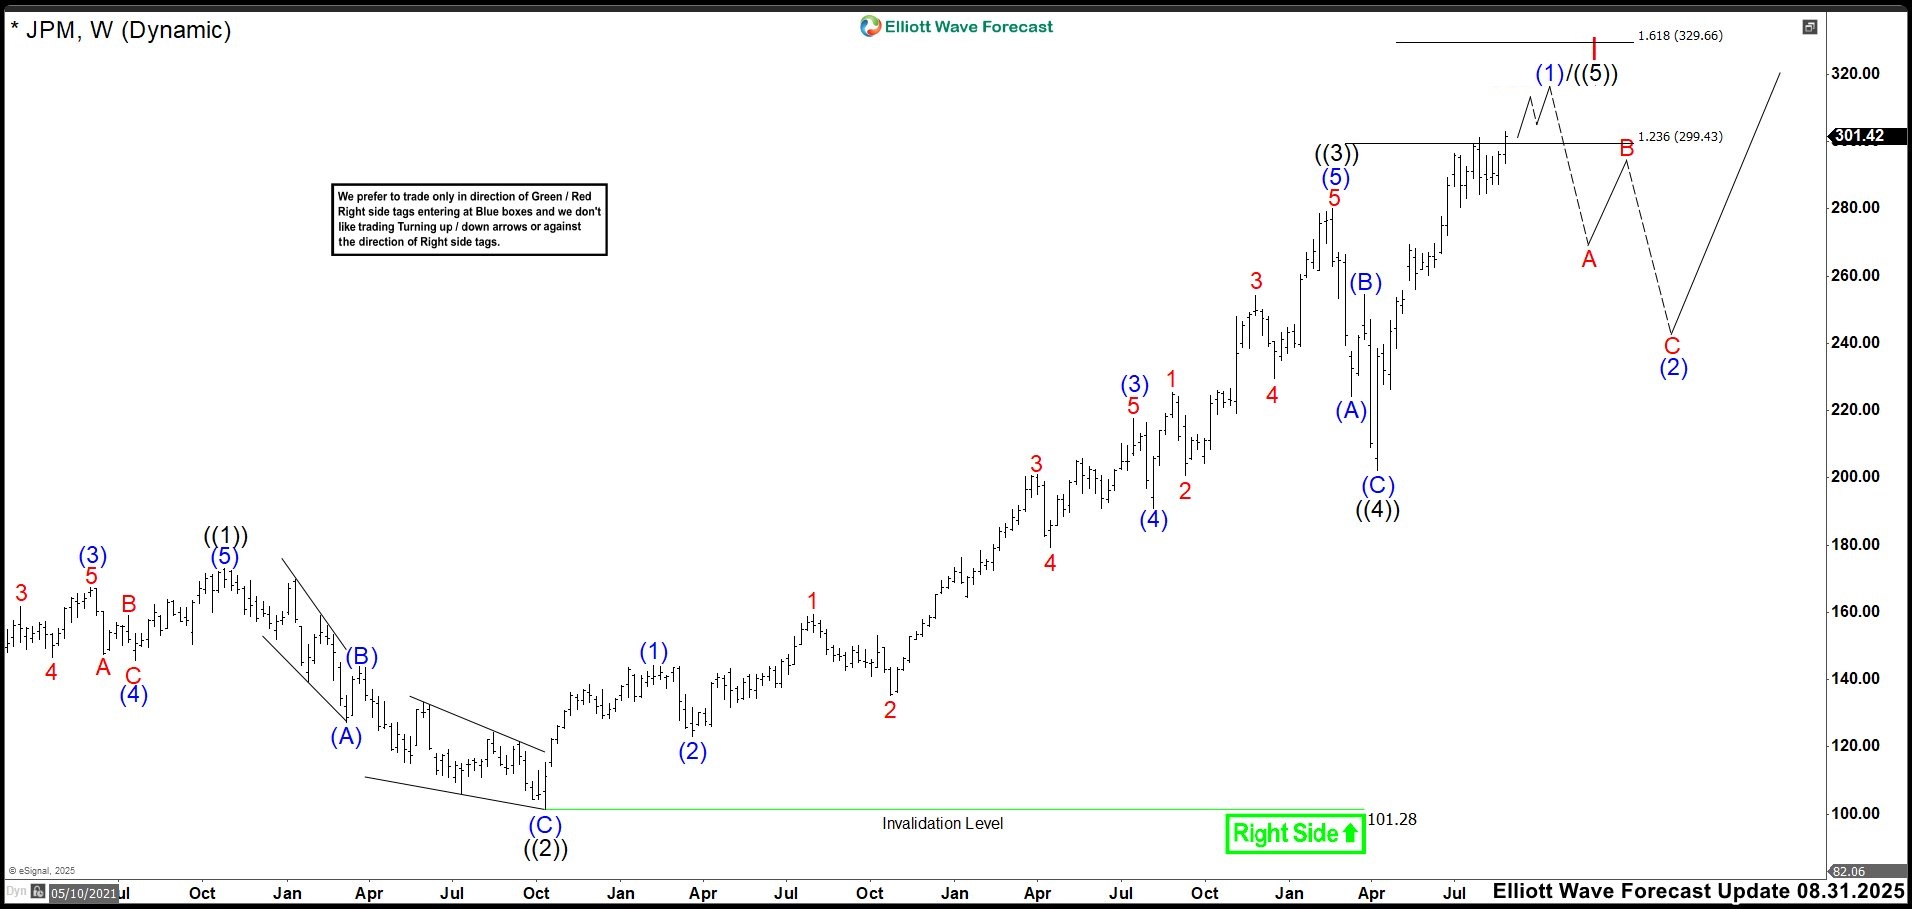
In this latest update, we observe that wave (5) of ((3)) extended to 280.25 high, completing wave ((3)). This was followed by a zigzag correction as wave ((4)), which found its bottom in April. From here, we see two possible scenarios: First, JPM could build a full impulsive structure to complete wave ((5)), finalizing the entire cycle as wave I. This would imply a deeper correction toward the 160–200 zone as wave II before resuming the bullish trend. The second scenario, which we are currently favoring, suggests the market is forming an extended wave ((5)). In this case, the rally from April would mark wave (1) of ((5)), and once the impulse ends, a corrective wave (2) could bring prices down to the 260–240 area before continuing higher.
At the moment, the impulse from the April low appears to be nearing its final phase, specifically wave 5 of (1). Unless further bullish extensions emerge, this move should be close to completion. Therefore, we expect continued upside until the impulse is fully formed. A sharp bearish reaction would signal the beginning of the corrective wave (2). We expect the current impulse could terminate within the 299.43–329.66 range, so traders holding long positions should closely monitor price action as we approach this zone.
Source: https://elliottwave-forecast.com/stock-market/jpm-bulls-fatigued-bears-warming/