Ralph Nelson Elliot developed the Elliott Wave Theory in the 1930s by. Influenced by Dow Theory and his extensive observation of market behavior, Elliott concluded that stock market movements follow repetitive and identifiable wave patterns. According to the theory, price action broke down in to two parts. First is in the motive wave that moves in the direction of the prevailing trend unfolds in five waves. While second is corrective waves which moves against the trend in three waves.
The five-wave sequence in the direction of the trend is labeled 1, 2, 3, 4, and 5. The corrective phase has a label of a, b, and c. These structures appear across all timeframes, from intraday charts to long-term cycles. In Elliott’s model, market prices alternate between impulsive (motive) and corrective phases at every degree of trend. Each motive wave further subdivides into five smaller waves: waves 1, 3, and 5 are motive, while waves 2 and 4 are corrective.
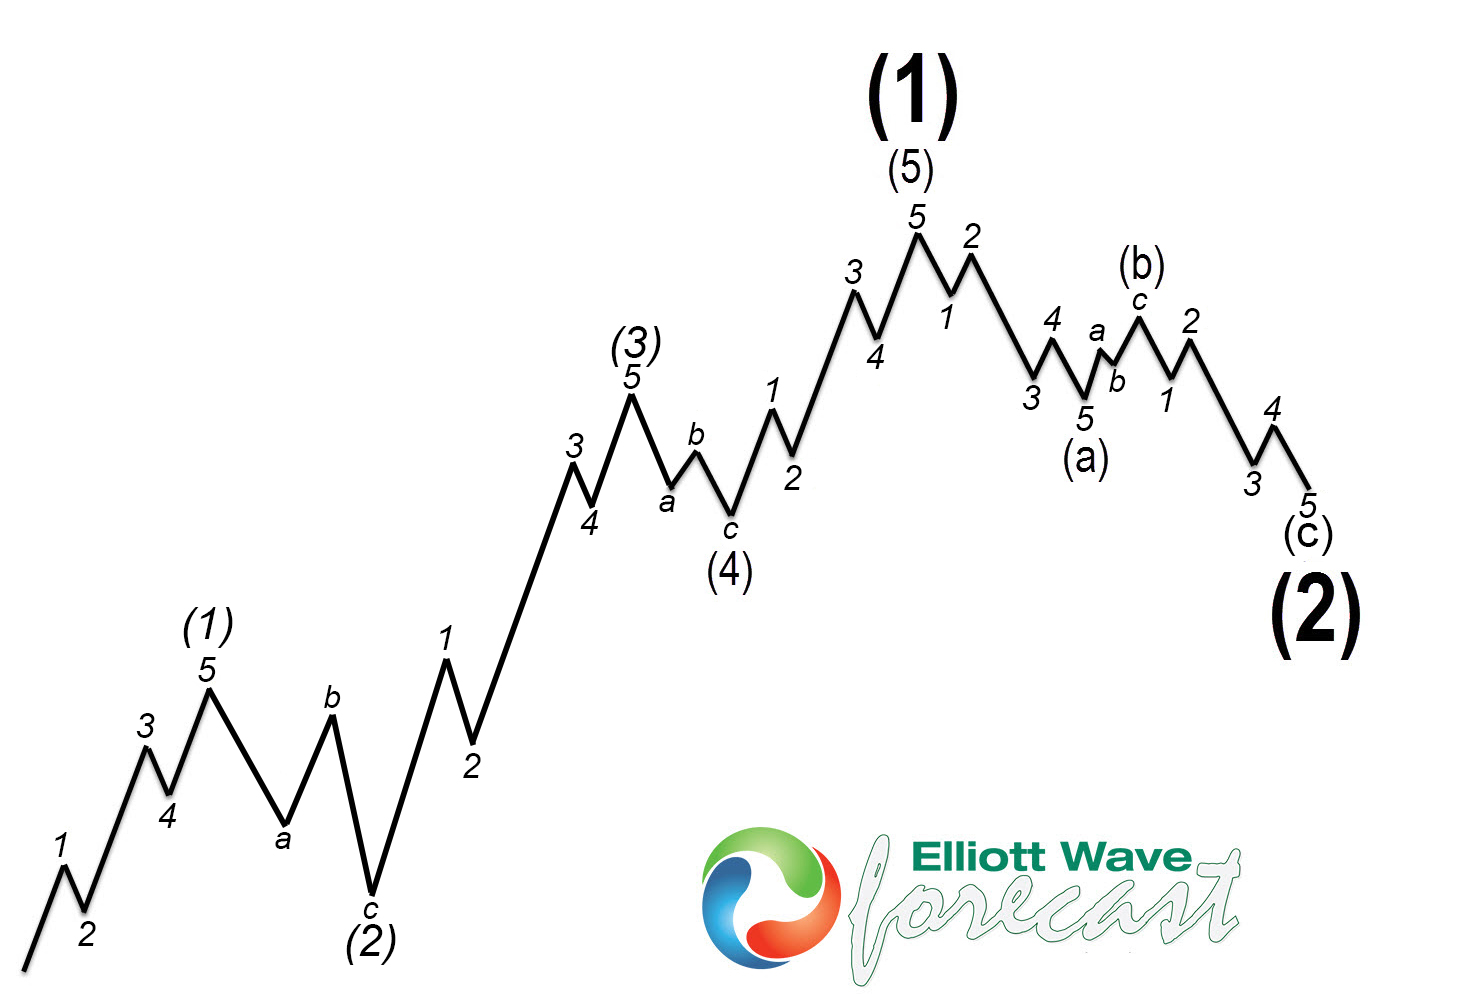
In Figure 1, waves 1, 3, and 5 are each subdivided into five smaller-degree waves labeled (1), (2), (3), (4), and (5). Waves (2) and (4), being corrective, typically subdivide into three waves labeled a, b, and c. Together, the full 1–5 sequence forms a higher-degree motive wave (1).
Corrective waves unfold in three smaller-degree waves labeled a, b, and c. Typically, wave a is a five-wave counter-trend move, wave b is a partial retracement, and wave c is another five-wave move in the direction of wave a. Combined, these form a larger corrective wave (2).
Elliott Wave Sequence: Figure 1
Although the theory was developed nearly a century ago, it remains remarkably relevant in today’s markets. At ElliottWave-Forecast.com, we publish nearly 100,000 chart updates annually, covering 78 instruments with multiple daily updates. Years of pattern recognition and cycle analysis have shown us that markets often react to predictable areas—despite what appears to be manipulation.
By studying these recurring patterns, we’ve developed a method to identify incomplete sequences and distinguish high-probability zones. For example, in trending markets, we often observe sequences of 5–9–13–17–21–25 swings, while corrective markets tend to follow 3–7–11–15–19–23–27. Using this sequence logic, combined with Fibonacci extensions and a system of validated pivots, we identify what we call predictable areas—zones with the highest probability for a market reaction. These are the Blue Boxes.
But why does the market behave this way? Who drives these precise movements? Consider the enormous volume traded every day—the speed, precision, and consistency of price behavior go far beyond what typical retail traders could produce. The answer is High-Frequency Trading (HFT). HFT is a method that uses powerful algorithms and computer systems to execute massive volumes of trades in fractions of a second. These machines operate at lightning speed across multiple markets, creating the high-frequency environments we now analyze.
Today’s market is fundamentally different from the 1930s. Recognizing that change, we’ve built a system designed for the modern environment. Our members gain access to these Blue Box areas. Although not guaranteed, it offers up to an 85% probability of producing a market reaction. It’s an edge that’s more than enough when applied with proper risk management.