
In this technical blog, we will look at the past performance of the Daily Elliott Wave Charts of the XAGUSD. The rally from the August 2022 low showed a higher high sequence & provided a swing buying opportunity at the blue box area. In this case, the pullback managed to reach the blue box area & provided a perfect reaction higher. So, we advised members not to sell Silver but to buy the blue box area for a minimum reaction higher to happen. We will explain the structure & forecast below:
XAGUSD Daily Elliott Wave Chart From 4.05.2025
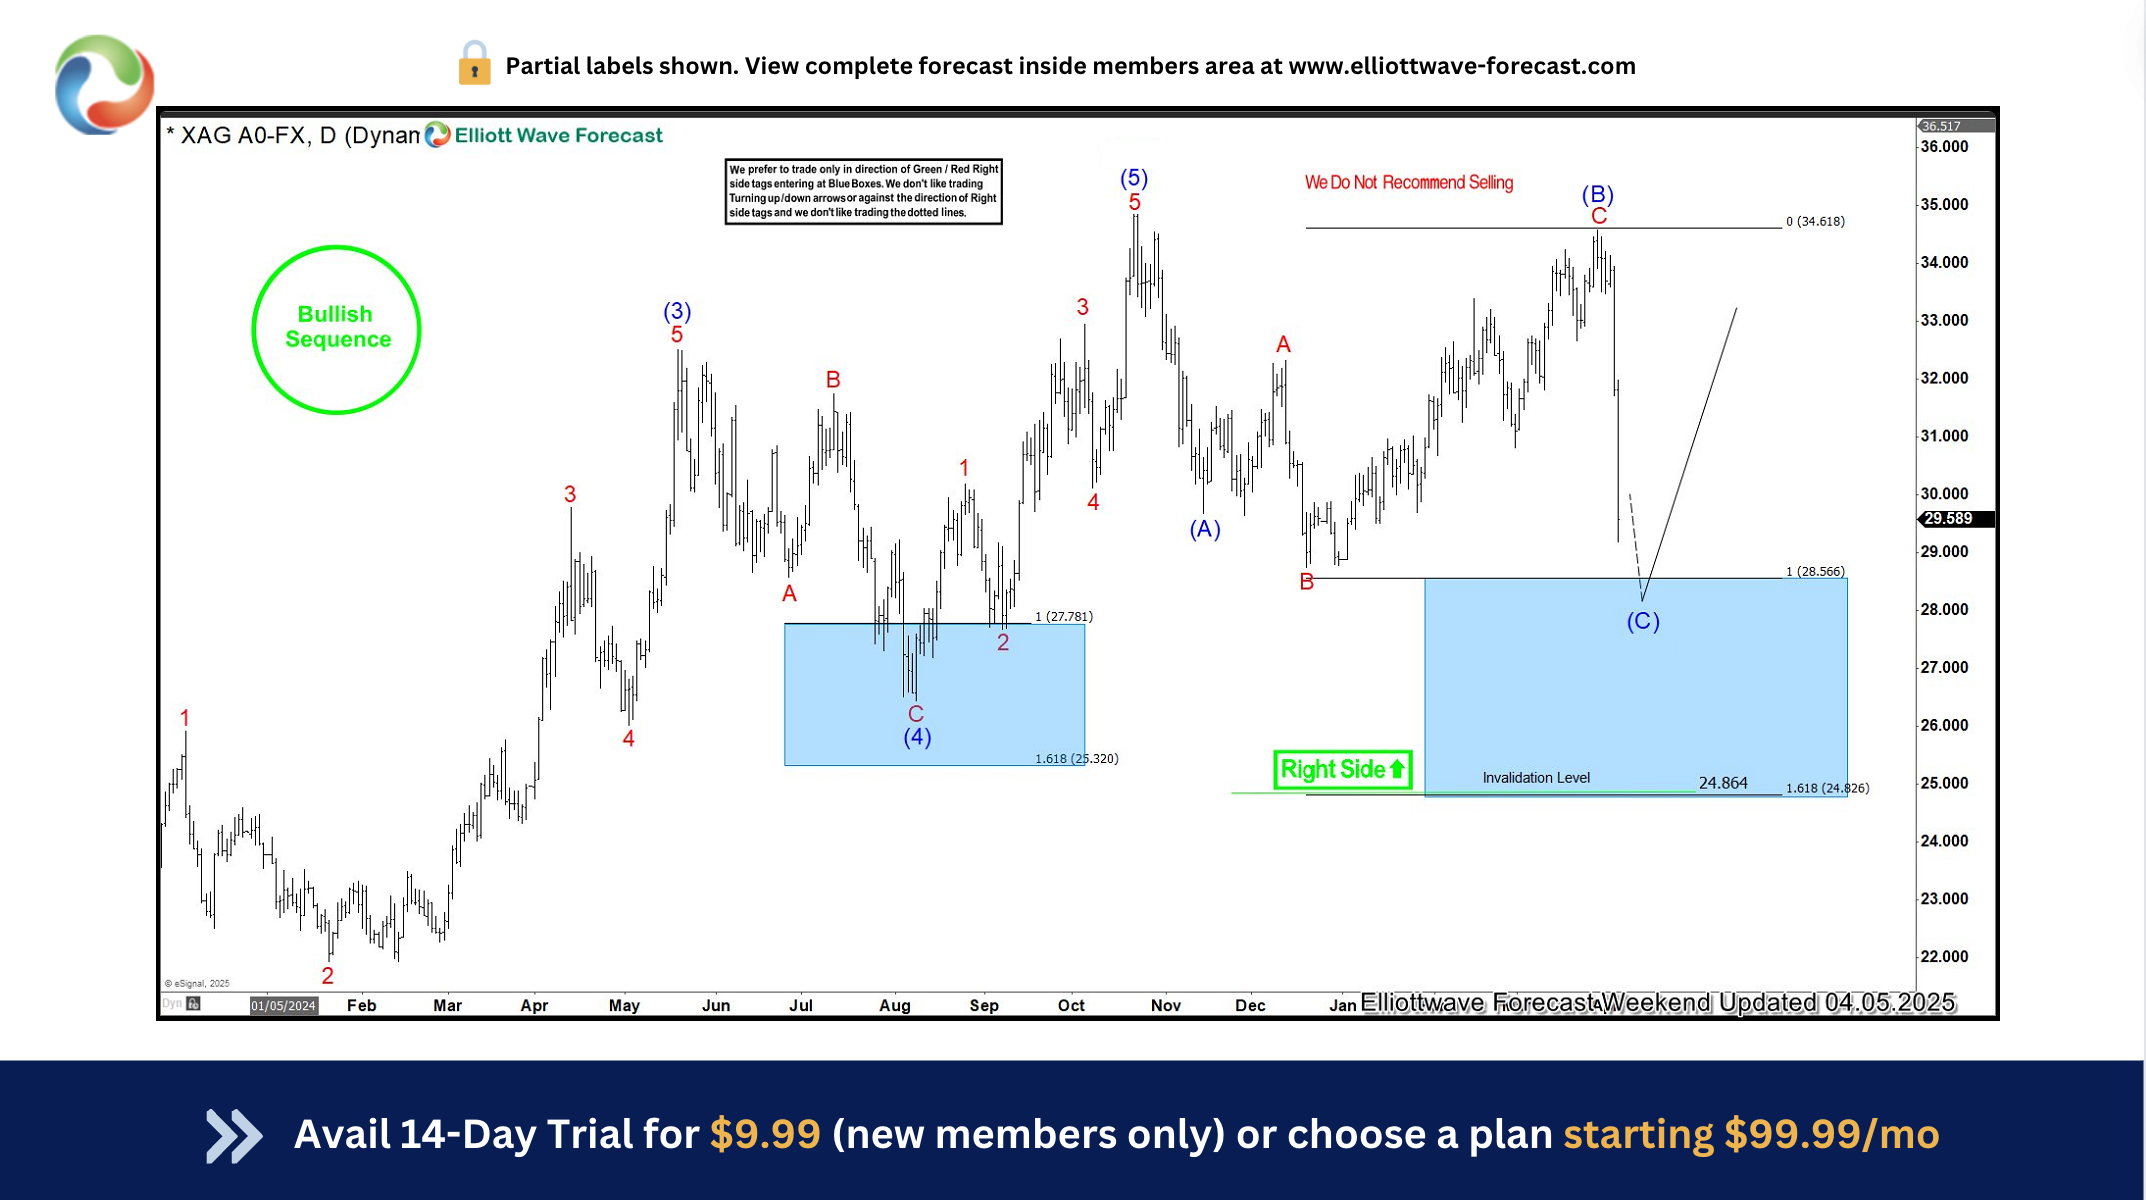
Here’s the Daily Elliott wave Chart from the 4.05.2025 Weekend update. In which, the rally to $34.86 high ended the cycle from March 2023 low & made a pullback against that cycle. The internals of that pullback unfolded as Elliott wave zigzag structure where wave (A) ended at $29.68 low. Then a bounce to $34.58 high-ended wave (B) & started the next leg lower in wave (C) towards $28.56- $24.82 equal legs area. From there, buyers were expected to appear looking for new highs ideally or for a 3-wave bounce minimum.
XAGUSD Latest Daily Elliott Wave Chart From 4.12.2025
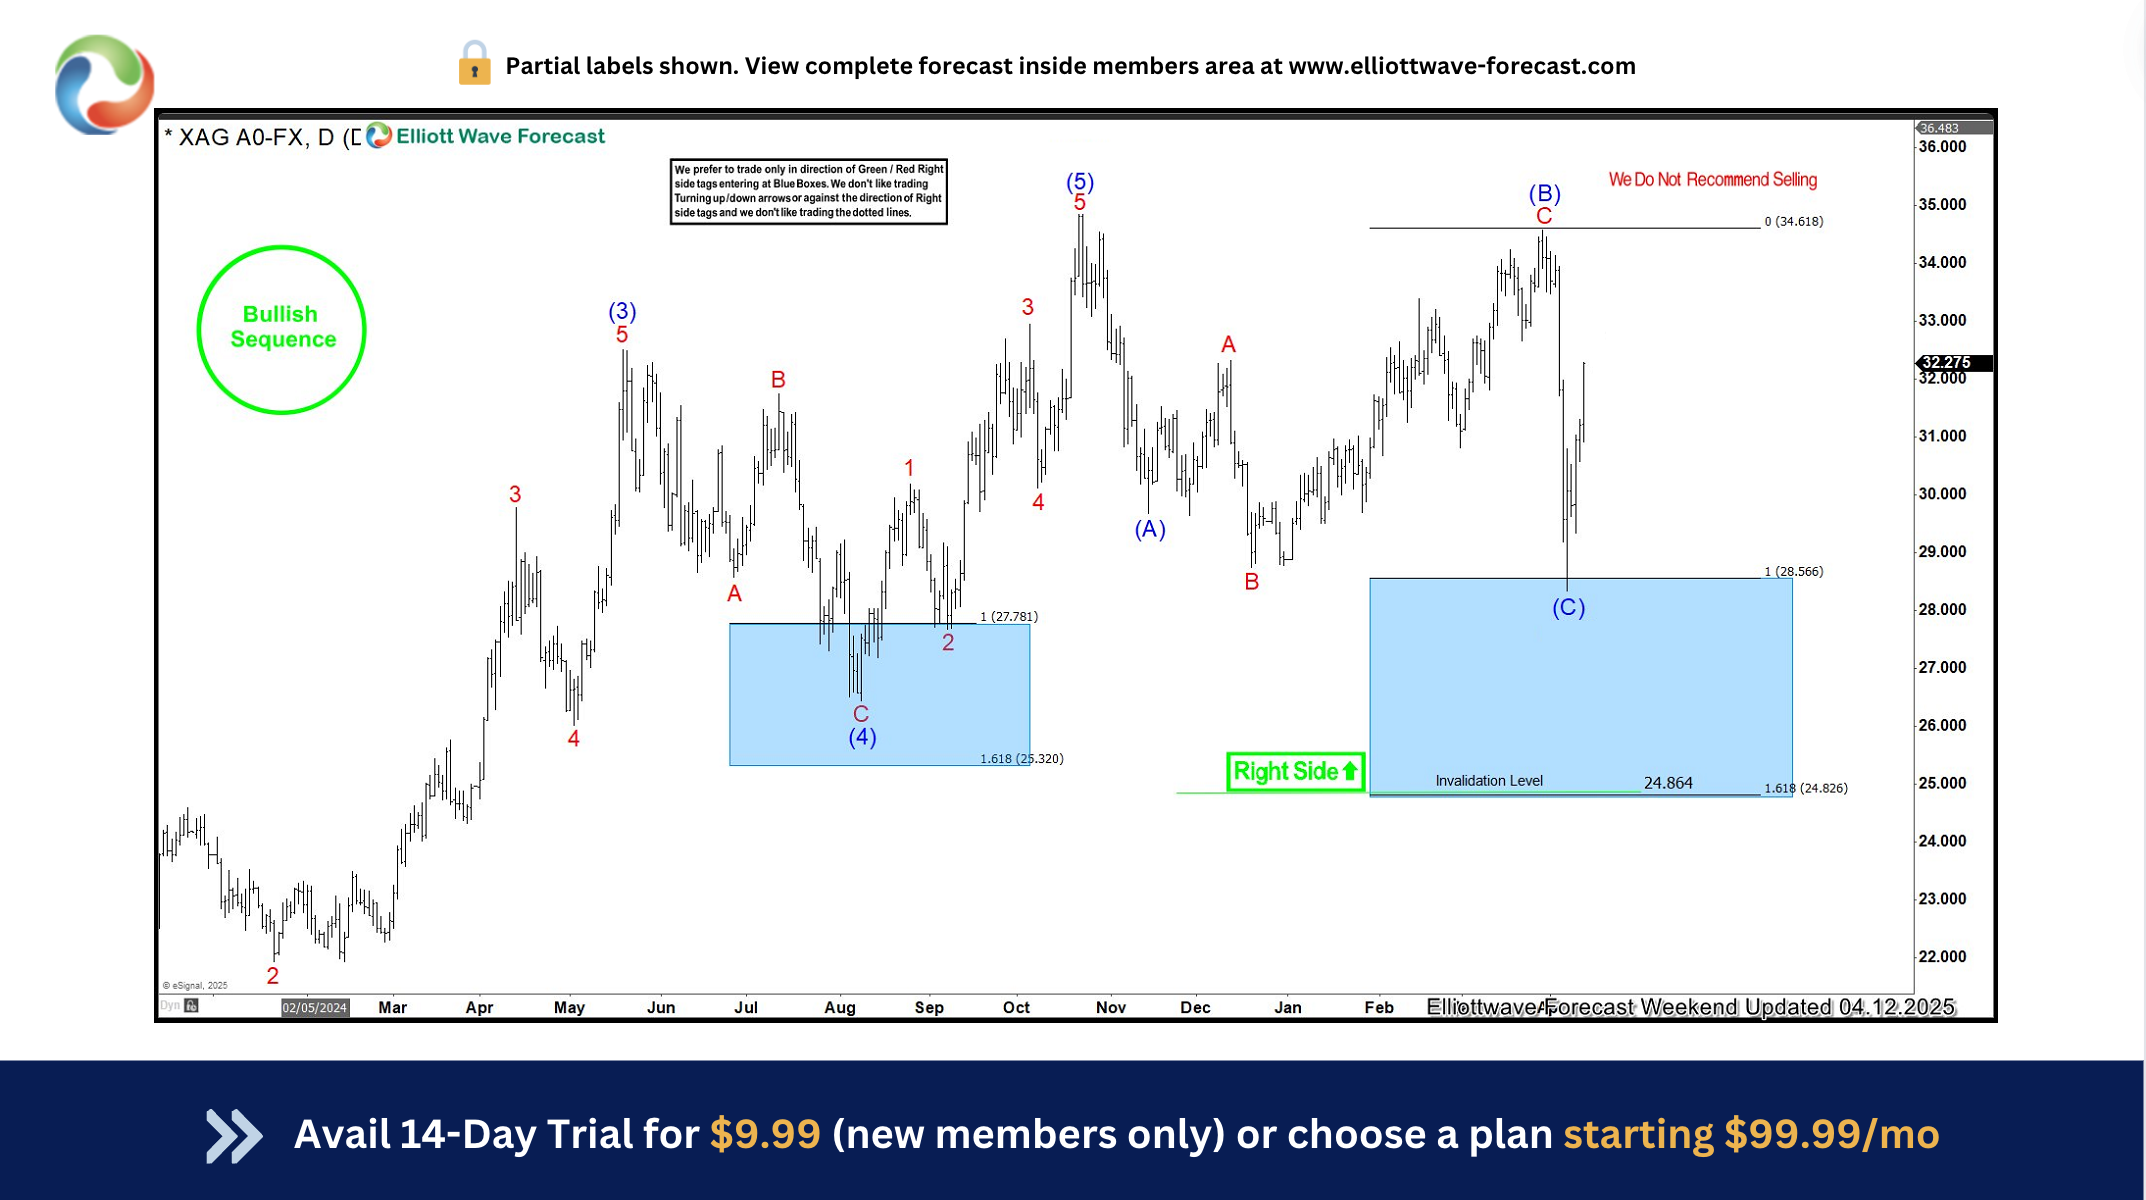
Above is the Latest Daily Elliott Wave Chart from 4.12.2025 Weekend update. In which the metal is showing a perfect reaction higher taking place from the blue box area. Right after ending the zigzag correction. Allowed members to create a risk-free position shortly after taking a long position. But a break above $34.86 high would still be needed to confirm the next leg higher minimum towards the $36.45- $38.97 area & avoid double correction lower.
Source: https://elliottwave-forecast.com/commodities/silvers-surge-xagusd-reacts-strongly-blue-box-area/