
In this technical blog, we will look at the past performance of the 1-hour Elliott Wave Charts of BAC. We presented to members at the elliottwave-forecast. In which, the rally from 16 April 2024 low unfolded as an impulse structure. Showing a higher high sequence in higher time frame favored more upside extension to take place. Therefore, we advised members not to sell the stock & buy the dips in 3, 7, or 11 swings at the blue box areas. We will explain the structure & forecast below:
BAC 1-Hour Elliott Wave Chart From 4.28.2024
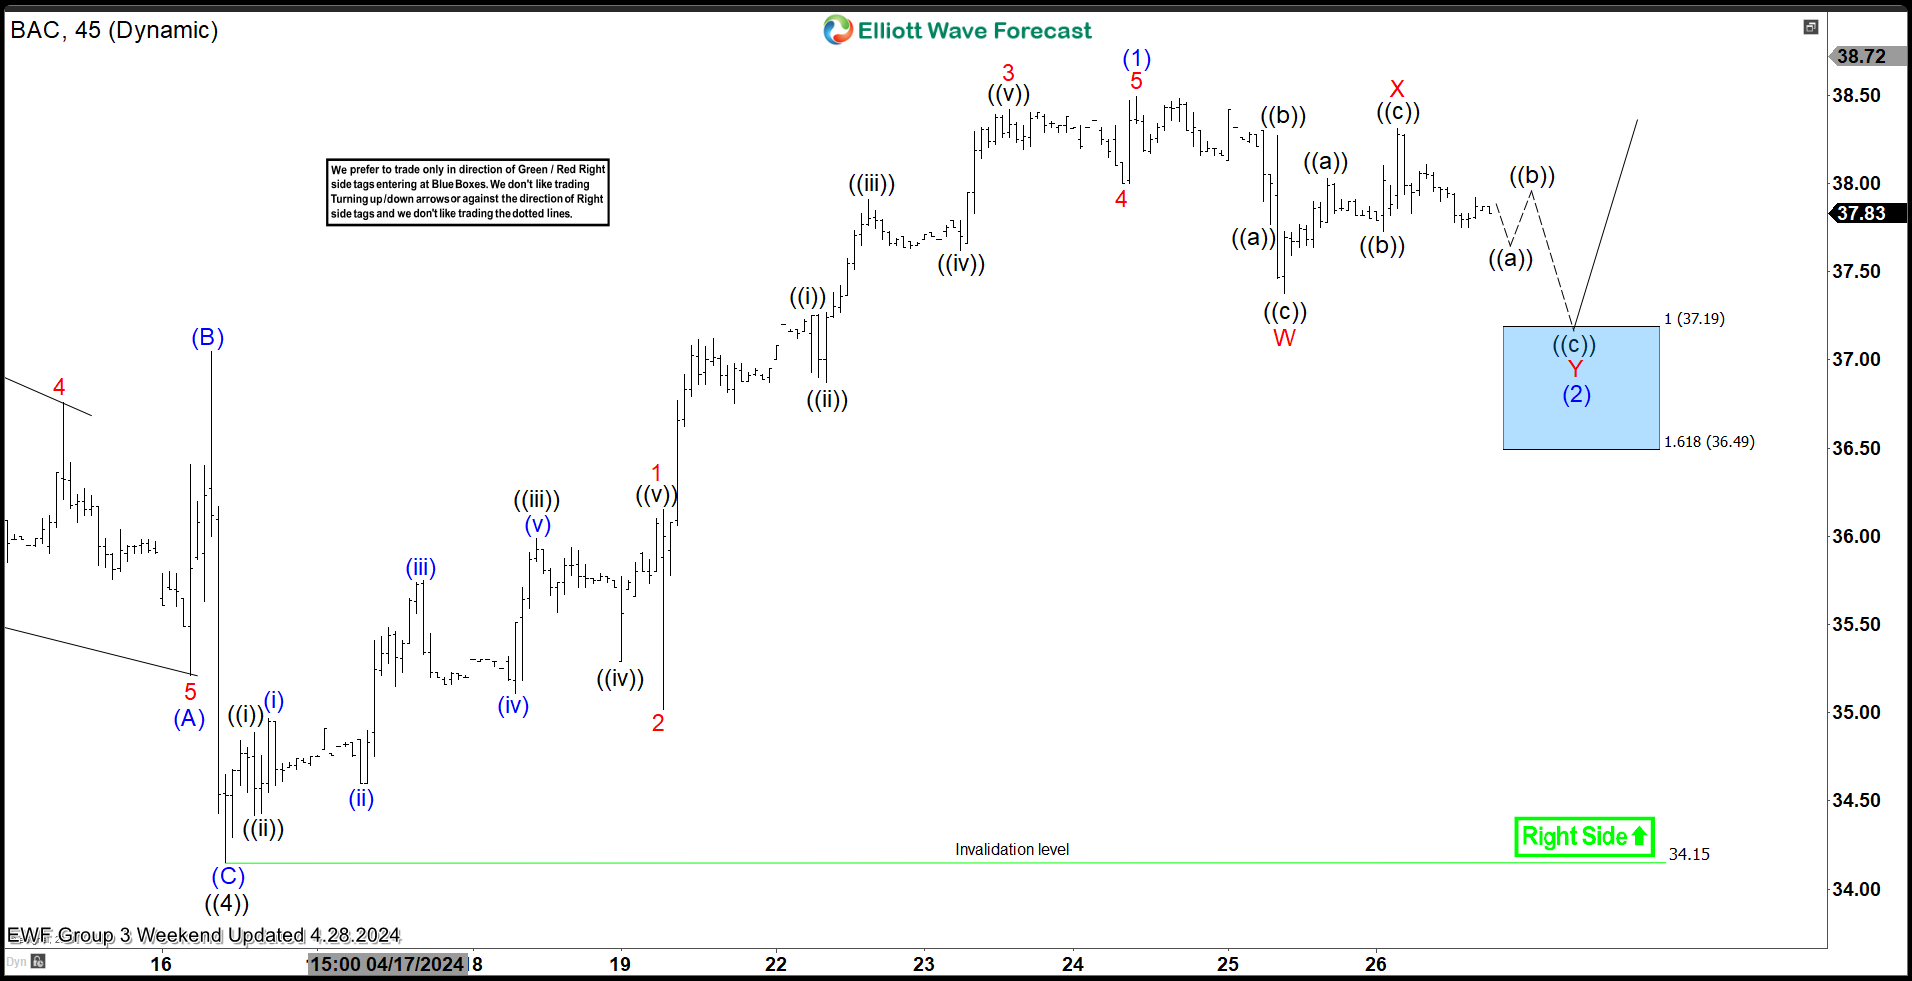
Here’s the 1-hour Elliott wave chart from the 3/11/2024 Pre-Market update. In which, the short-term cycle from the 4/16/2024 low ended in wave (1) at $38.49 high. Down from there, the stock made a pullback in wave (2) to correct that cycle. The internals of that pullback unfolded as Elliott wave double three structure where wave W ended at $37.38 low. Wave X bounce ended at $38.31 high and wave Y managed to reach the blue box area at $37.19- $36.49. From there, buyers were expected to appear looking for the next leg higher or for a 3 wave bounce minimum.
BAC Latest 1-Hour Elliott Wave Chart From 5.13.2024
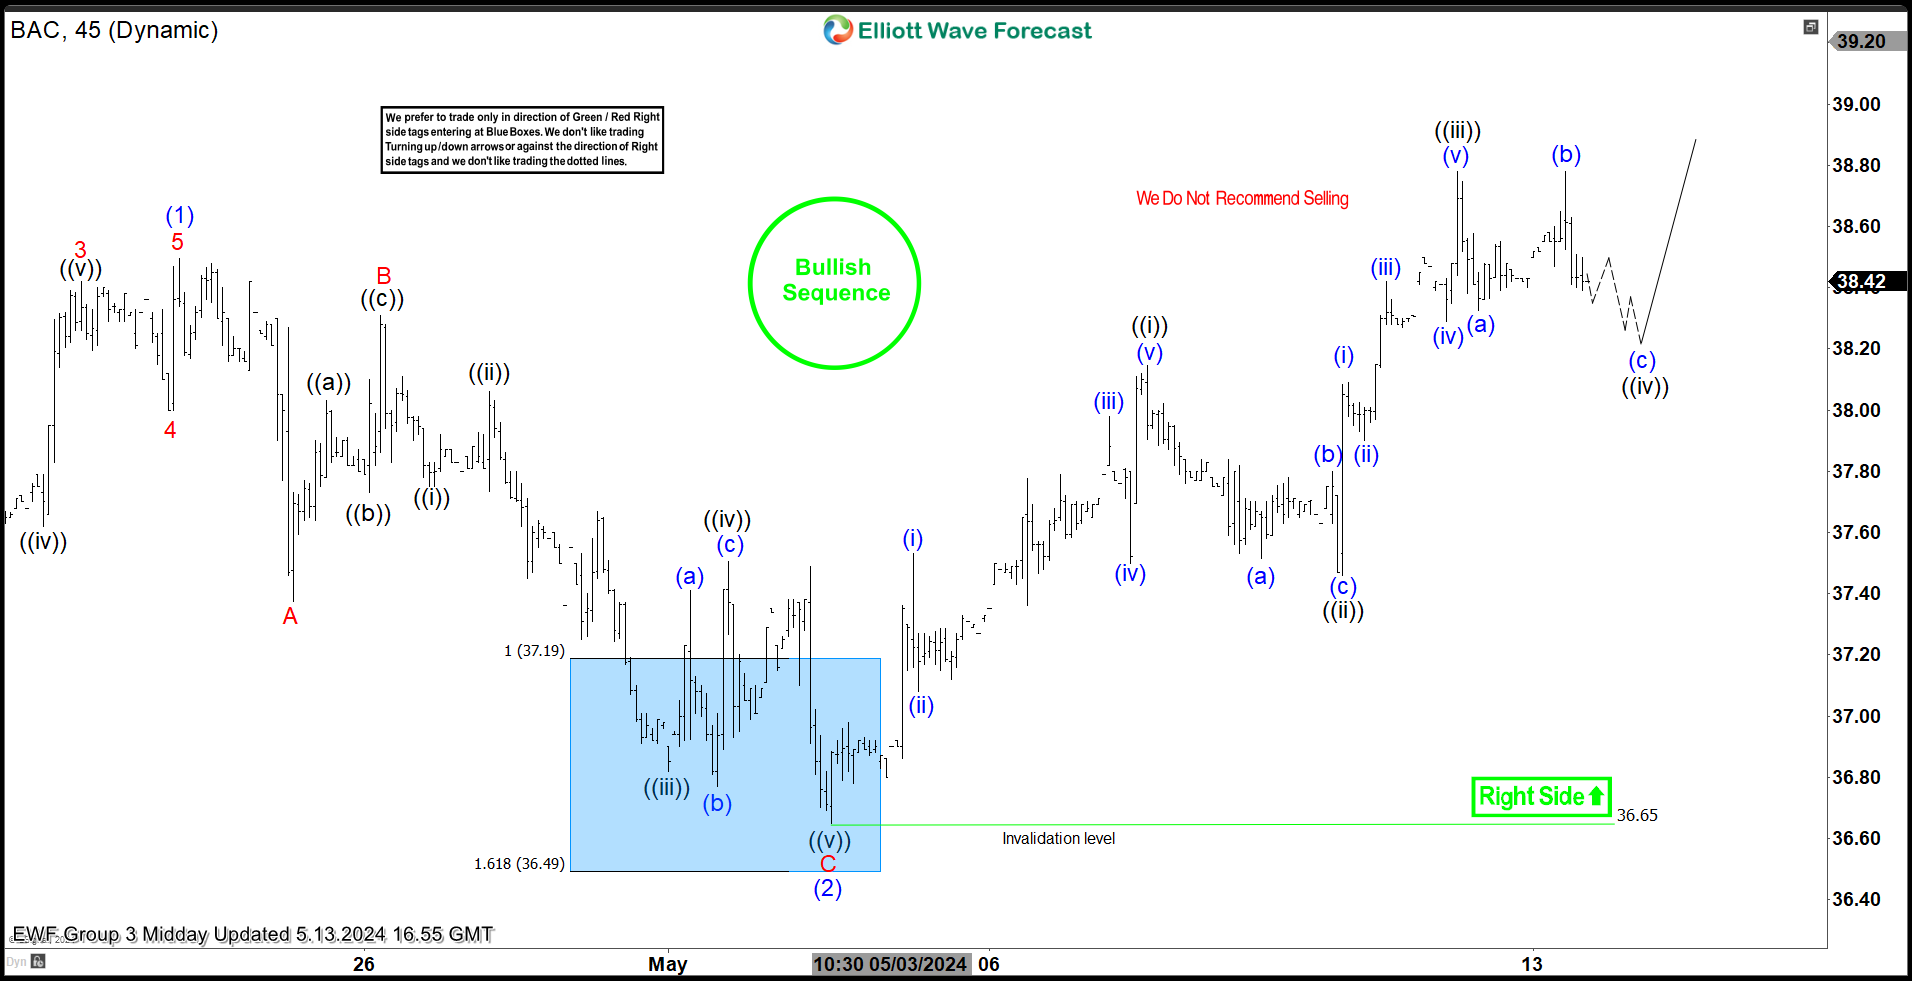
This is the latest 1-hour Elliott wave Chart from the 5/13/2024 Midday update. In which the stock is showing a reaction higher taking place, right after ending the zigzag correction within the blue box area. Allowed members to create a risk-free position shortly after taking the long position at the blue box area. Since then, the stock has already made a new high above $38.49 high confirming the next extension higher. Also, it’s important to note that with further data the pullback was adjusted to zigzag correction.
Source: https://elliottwave-forecast.com/stock-market/bac-made-new-highs-blue-box-area/