
Hello everyone. In today’s article, we will look at the past performance of the 1H Hour Elliott Wave chart of NVIDIA Corp ($NVDA) . The rally from 3.19.2024 low at $850.05 unfolded as 5 waves impulse. So, we expected the pullback to unfold in 3 swings and find buyers again. We will explain the structure & forecast below:
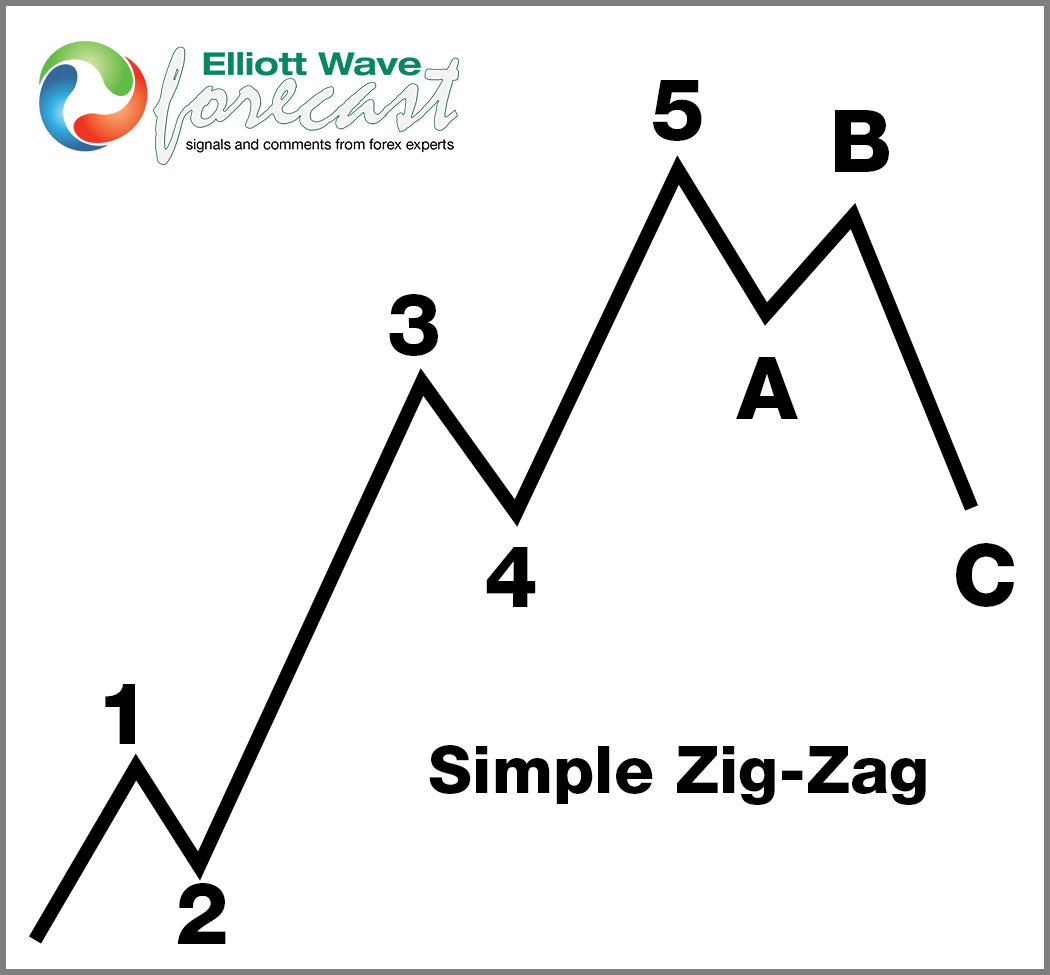
5 Wave Impulse Structure + ABC correction
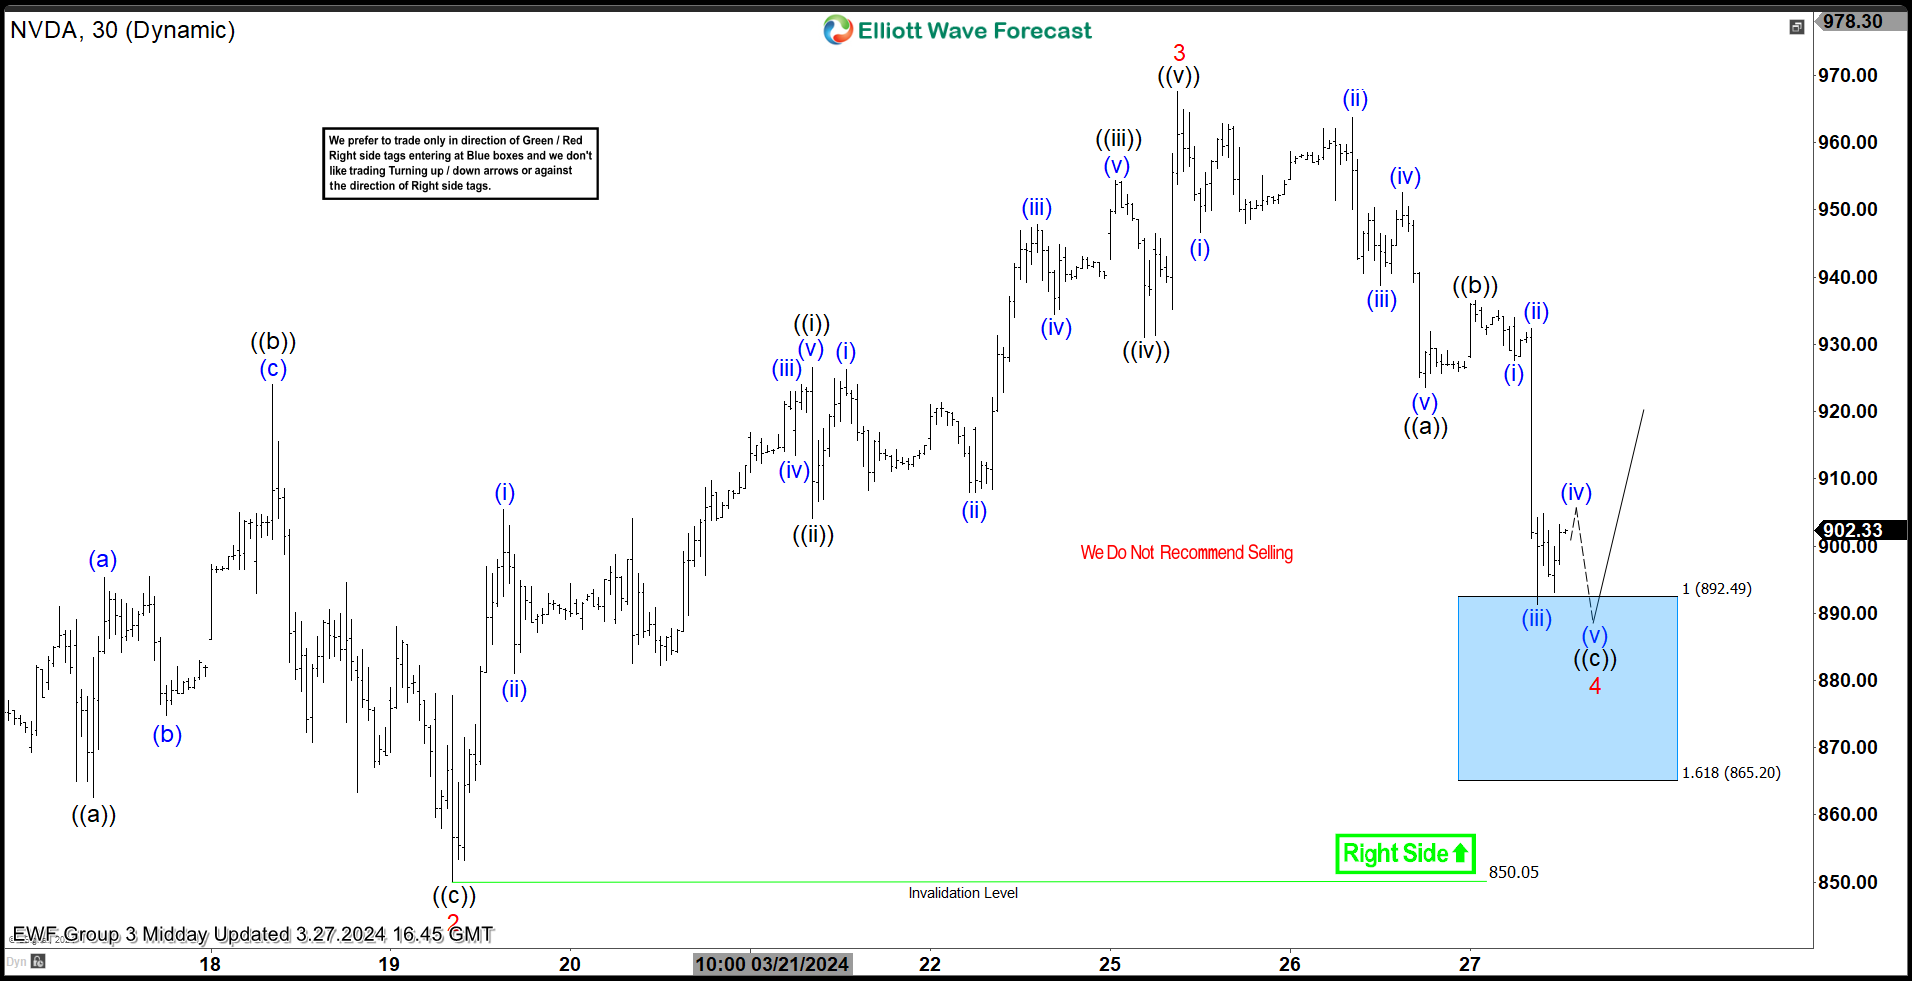
$NVDA 1H Elliott Wave Chart 3.27.2024:
Here is the 1H Elliott Wave count from 3.27.2024. We expected the pullback to find buyers at the blue box area at 892.49 – 865.20 in 3 swings.
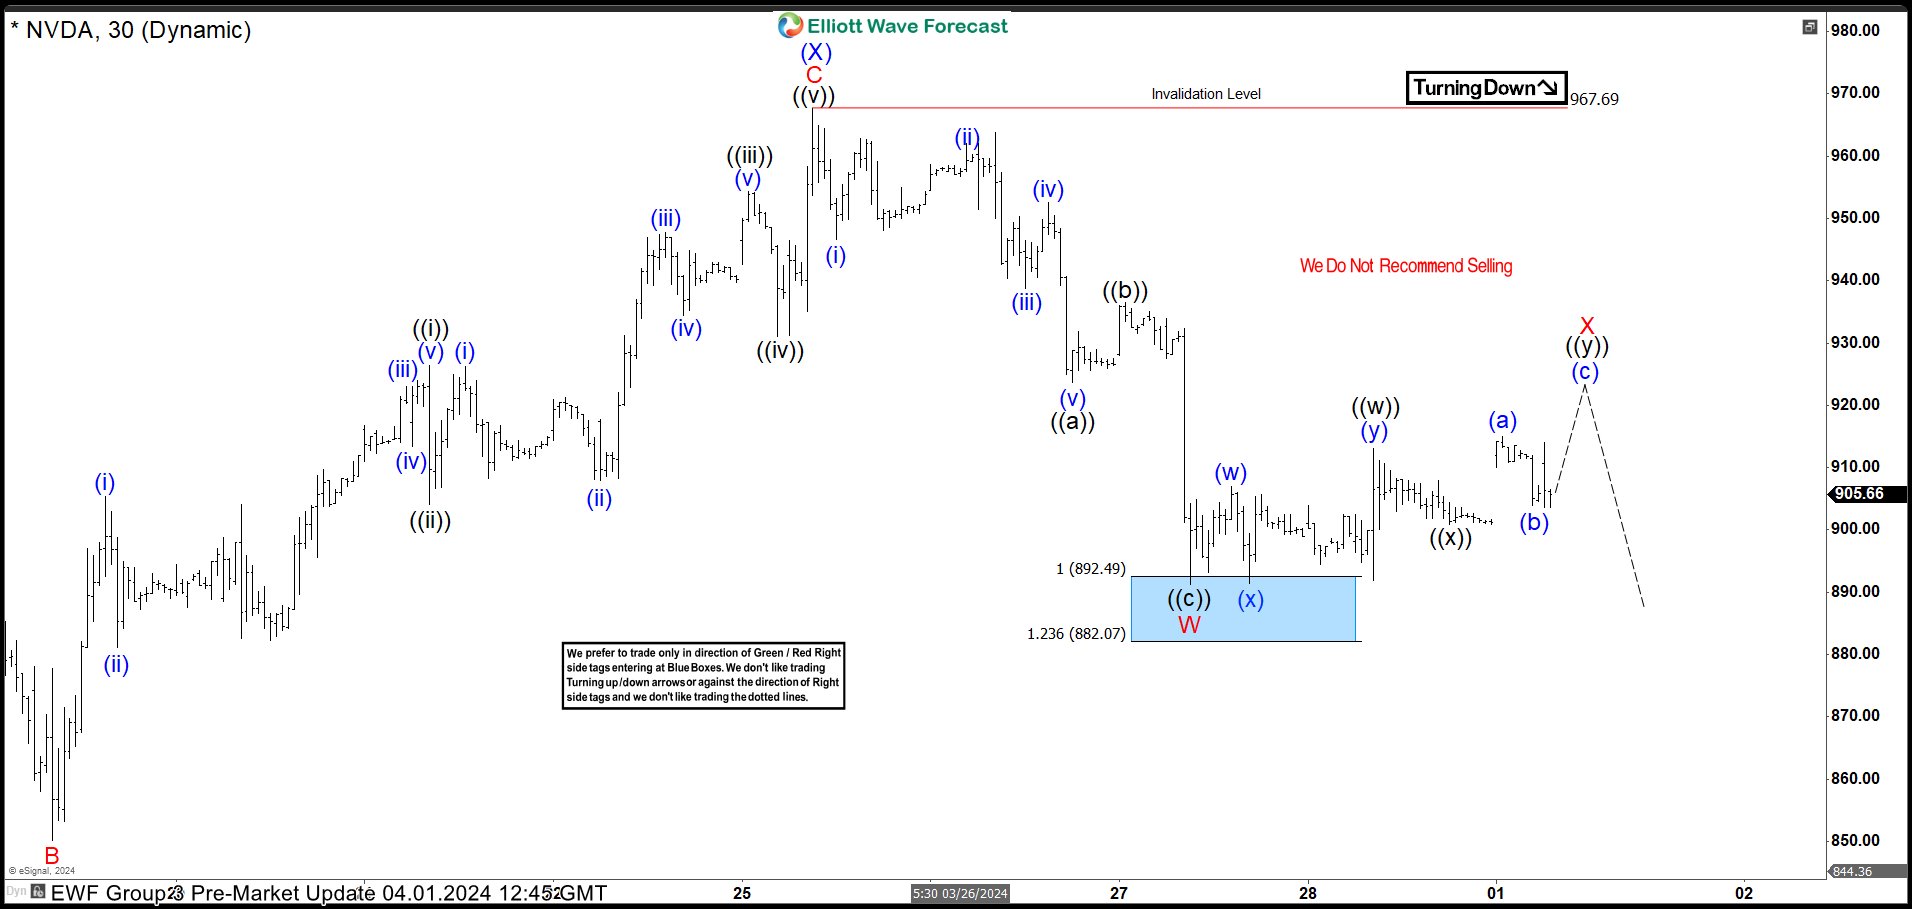
$NVDA 1H Elliott Wave Chart 4.01.2024:
Here is the latest 1H update from 4.01.2024 showing the bounce taking place as expected. The stock has reacted higher from the blue box area allowing longs to get risk free. The stock can be doing a double three correction (WXY) before resuming the rally where traders can enter again. A break above $967.69 will negate the double and confirm that the next leg higher has started.
Source: https://elliottwave-forecast.com/stock-market/nvidia-corp-nvda-found-buyers-blue-box-area-expected/