
Hello everyone. In today’s article, we will look at the past performance of the 4H Hour Elliott Wave chart of Alphabet Inc. ($GOOGL). The rally from 10.27.2023 low at $120.25 unfolded as 5 waves impulse. So, we expected the pullback to unfold in 3 swings and find buyers again. We will explain the structure & forecast below:
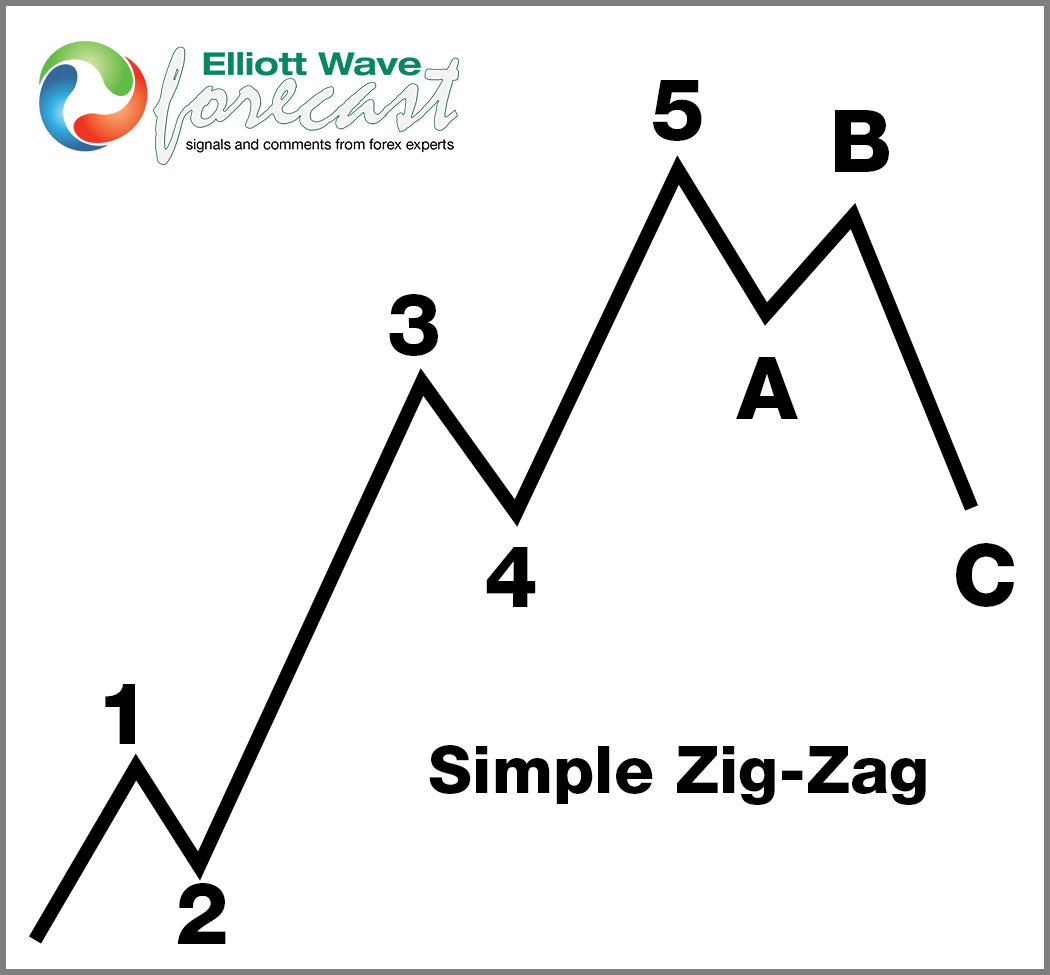
5 Wave Impulse Structure + ABC correction
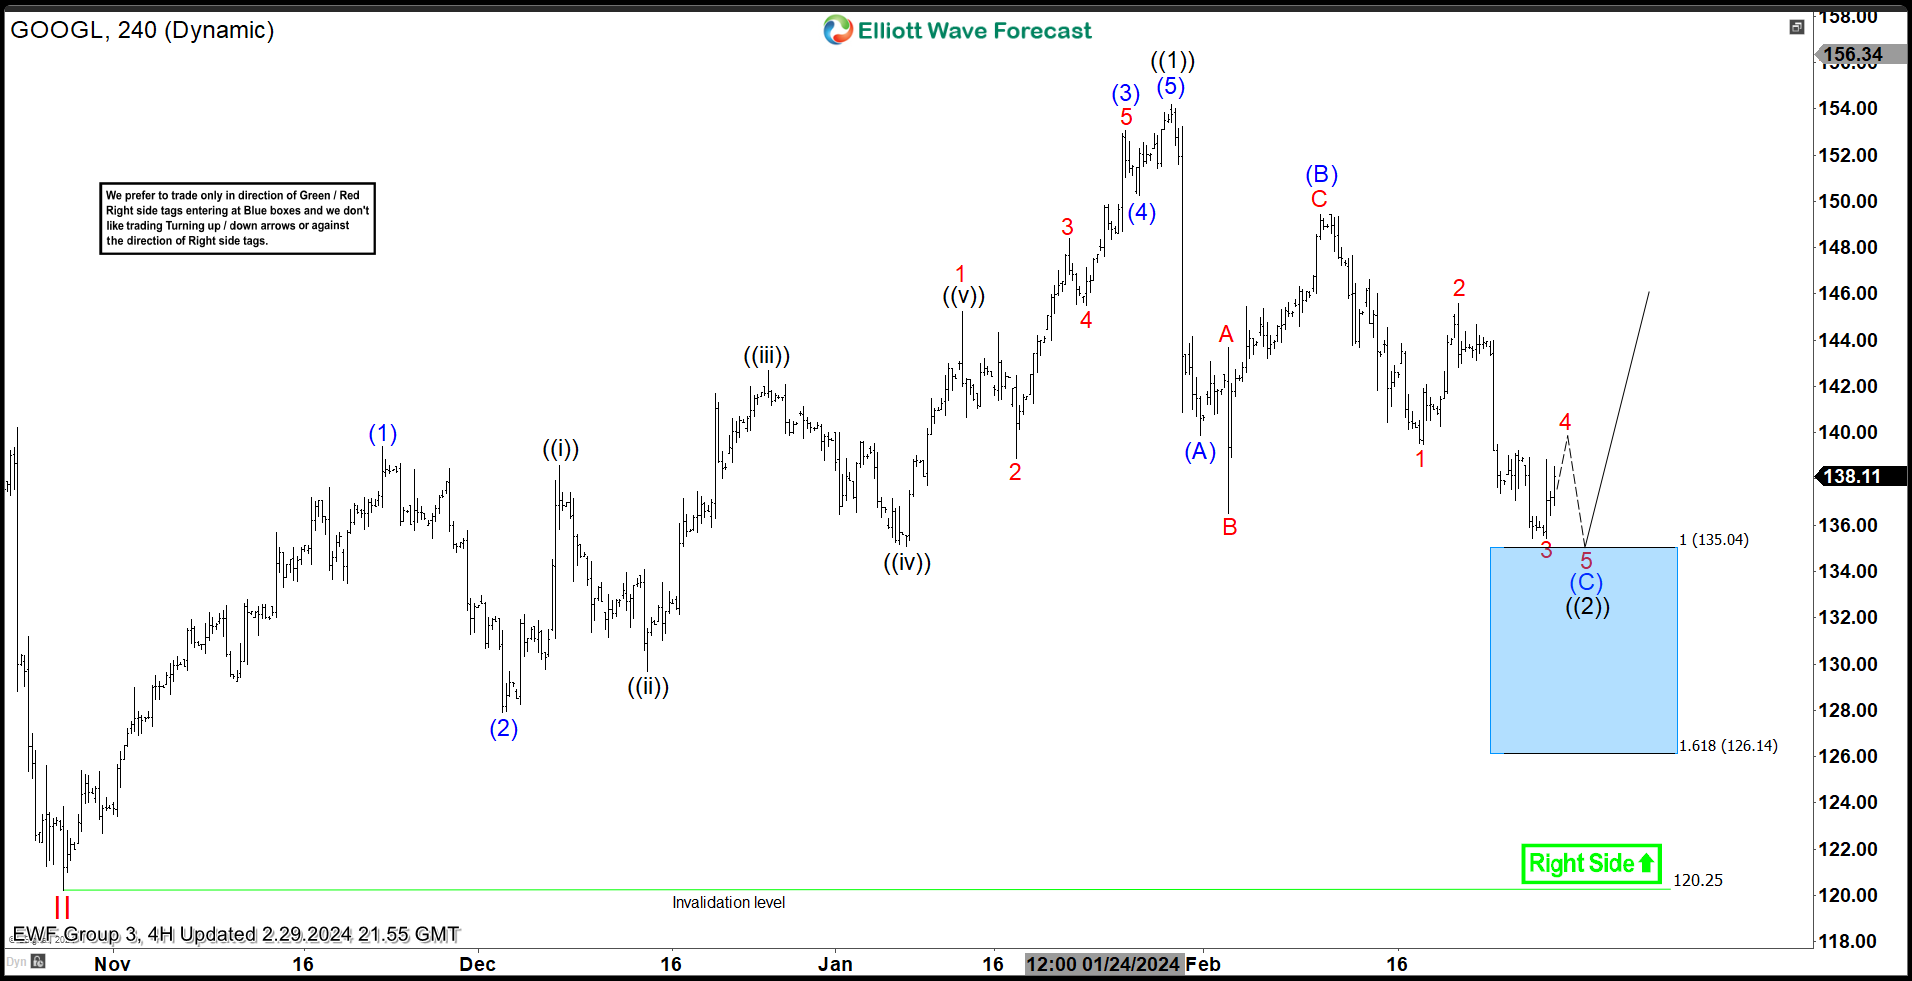
$GOOGL 4H Elliott Wave Chart 2.29.2024:
Here is the 4H Elliott Wave count from 2.29.2024. We expected the pullback to find buyers at the blue box area at 135.04 – 126.14 in 3 swings.
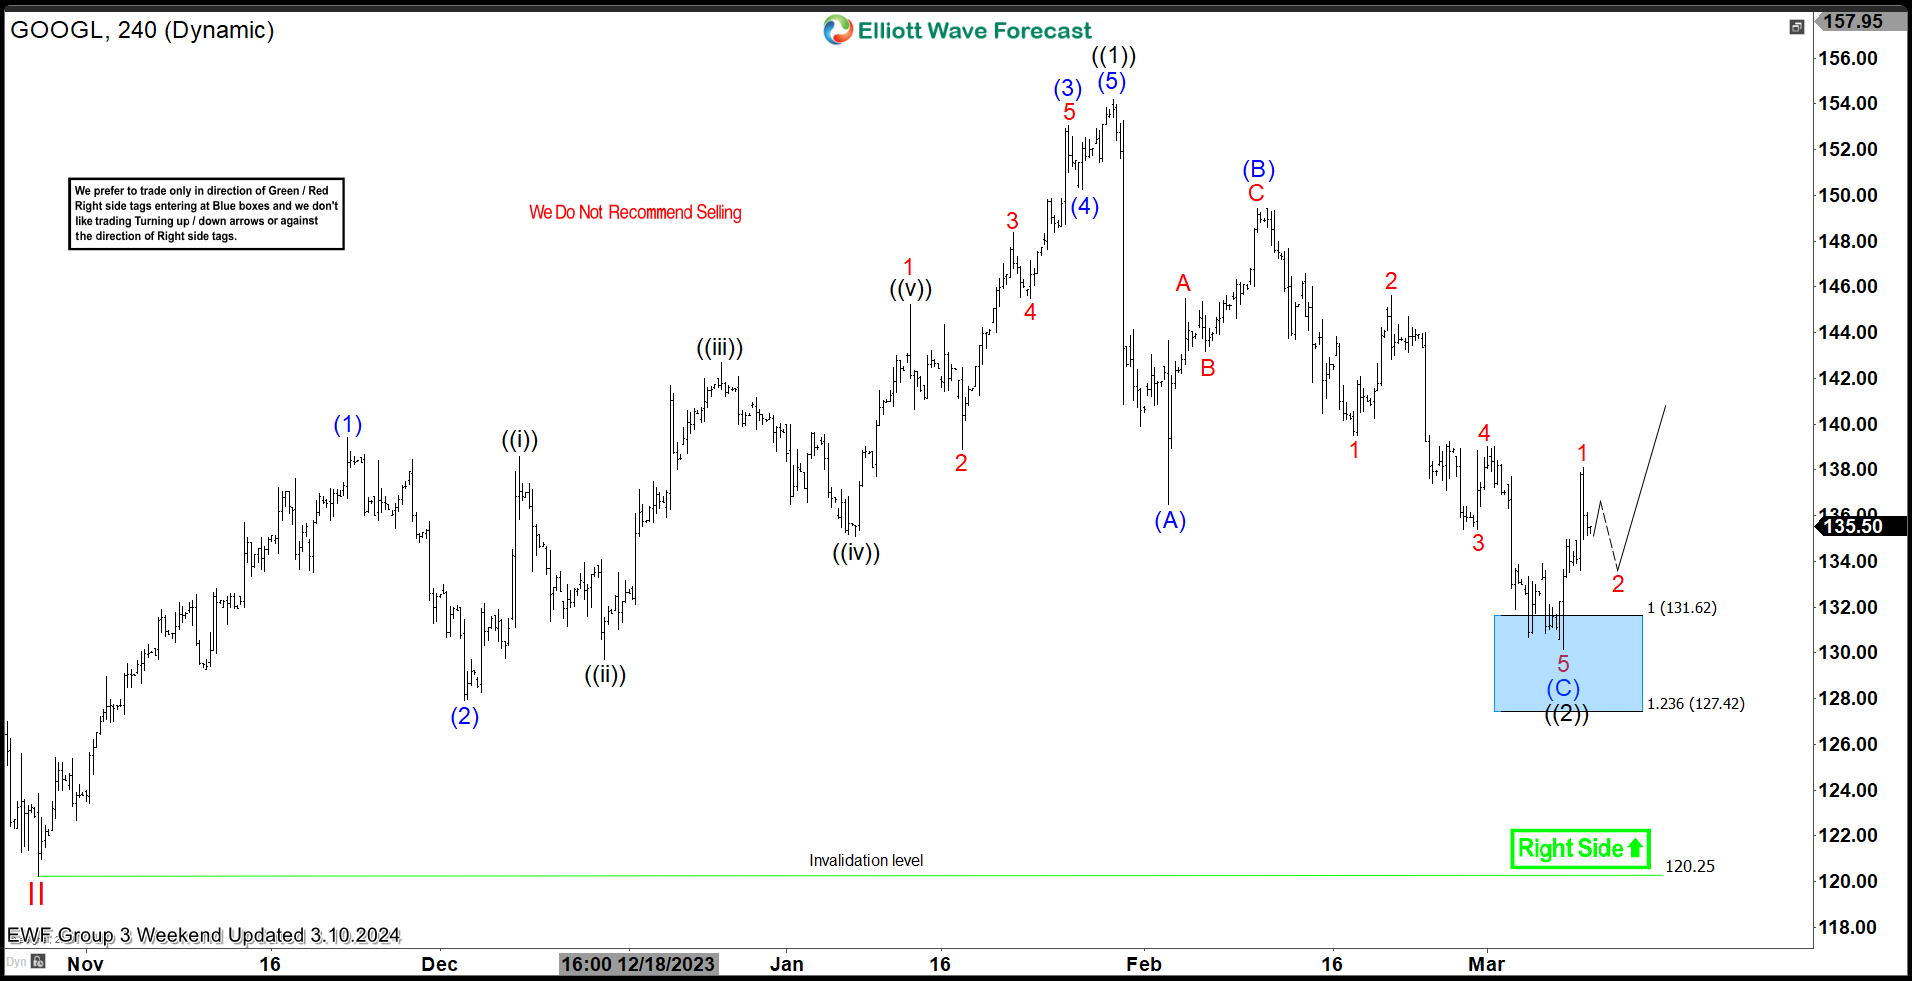
$GOOGL 4H Elliott Wave Chart 3.11.2024:
Here is the latest 4H update from 3.10.2024 showing the bounce taking place as expected. The stock has reacted higher from the blue box area ending the 3 swings decline. The stock is expected to remain supported towards $142 – 145 where longs will be able to get risk free. A break above 1.29.2024 peak at 153.78 will open the next leg higher towards $164 – 185.