Sony Group Corporation, commonly known as SONY, is a Japanese multinational conglomerate corporation. As a major technology company, it operates as one of the world’s largest manufacturers of consumer and professional electronic products, the largest video game console company.
SONY ended an impulse that began at the end of 2012. The share price reached 133.75 in January 2021, that was, 9 years of upward movement. We called this impulse as wave (I). The price started to fall forming a double correction and after almost 5 months wave (II) ended reacting from the blue box area.
SONY Weekly Chart October 2023
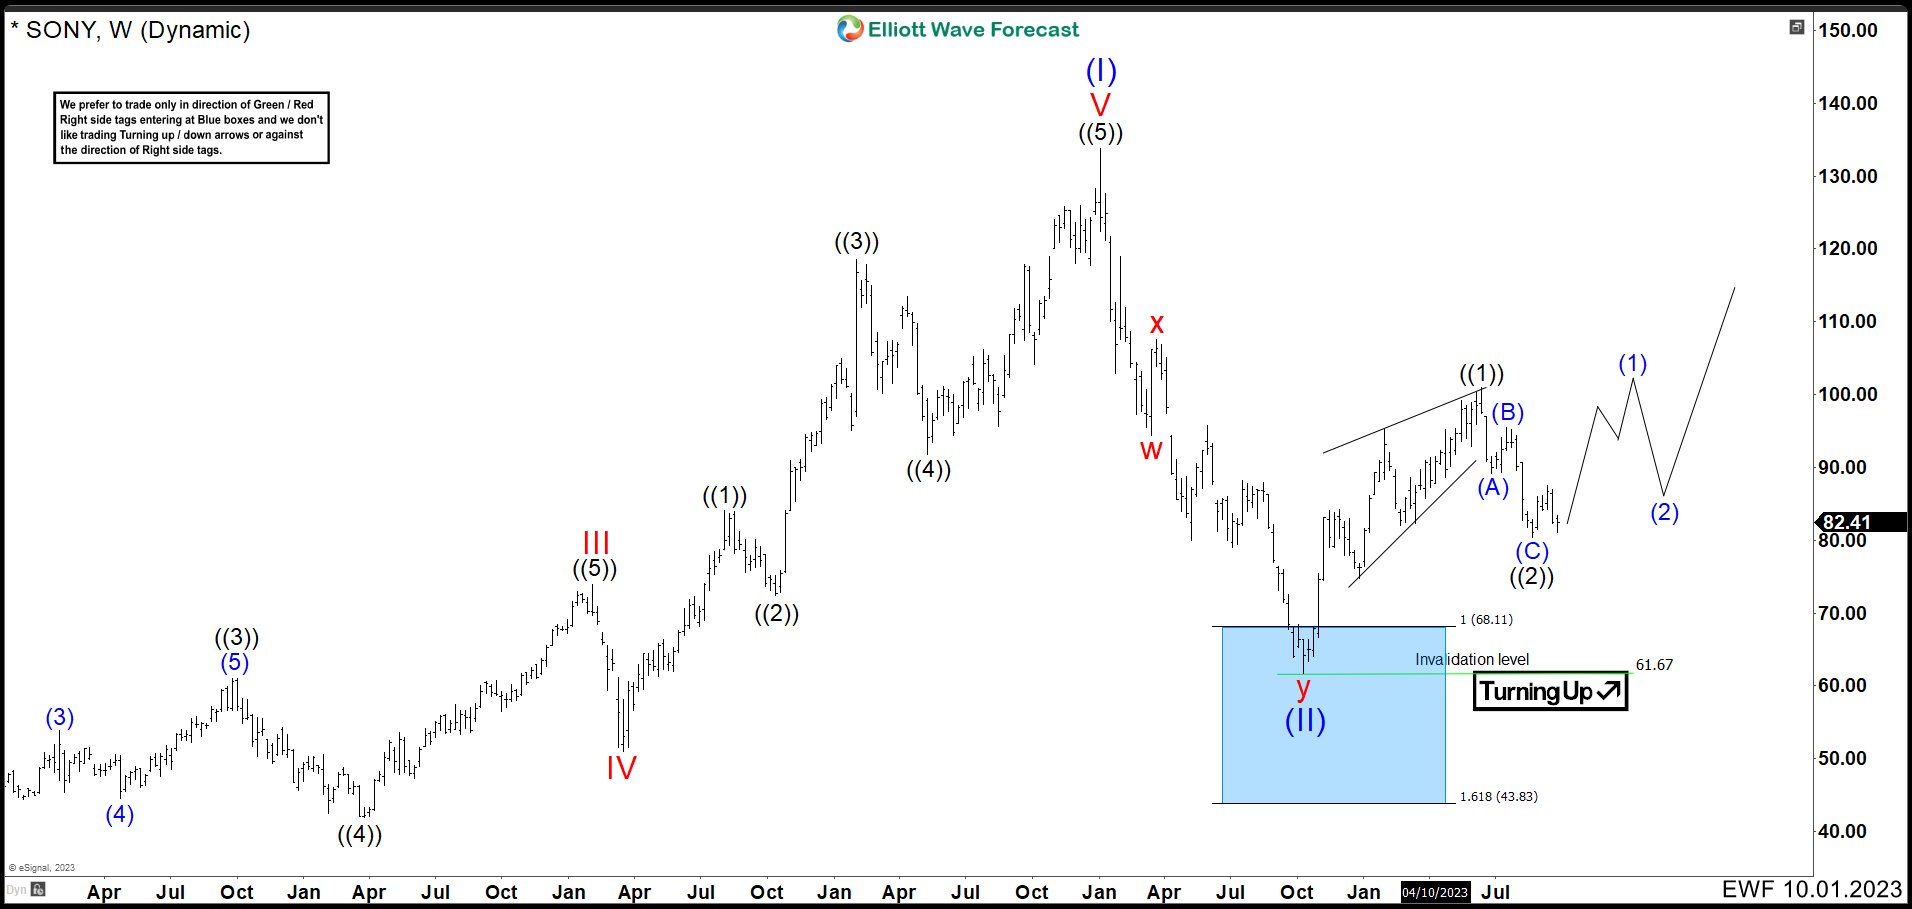
Last October, we suggested two scenarios for the next move of SONY. The first one is that wave ((2)) was not ended and it is going to rally in wave (B) correction. Then the market should turn down in wave (C) to completed wave ((2)) pullback before resuming to the upside. The second scenerio was the chart above. We have selected this one because market conditions. Indices like SPX and NASDAQ are showing a bullish structure and there is no way for now to think in deep pullbacks. Therefore, SONY should keep going with the uptrend structure.
SONY Weekly Chart January 2024
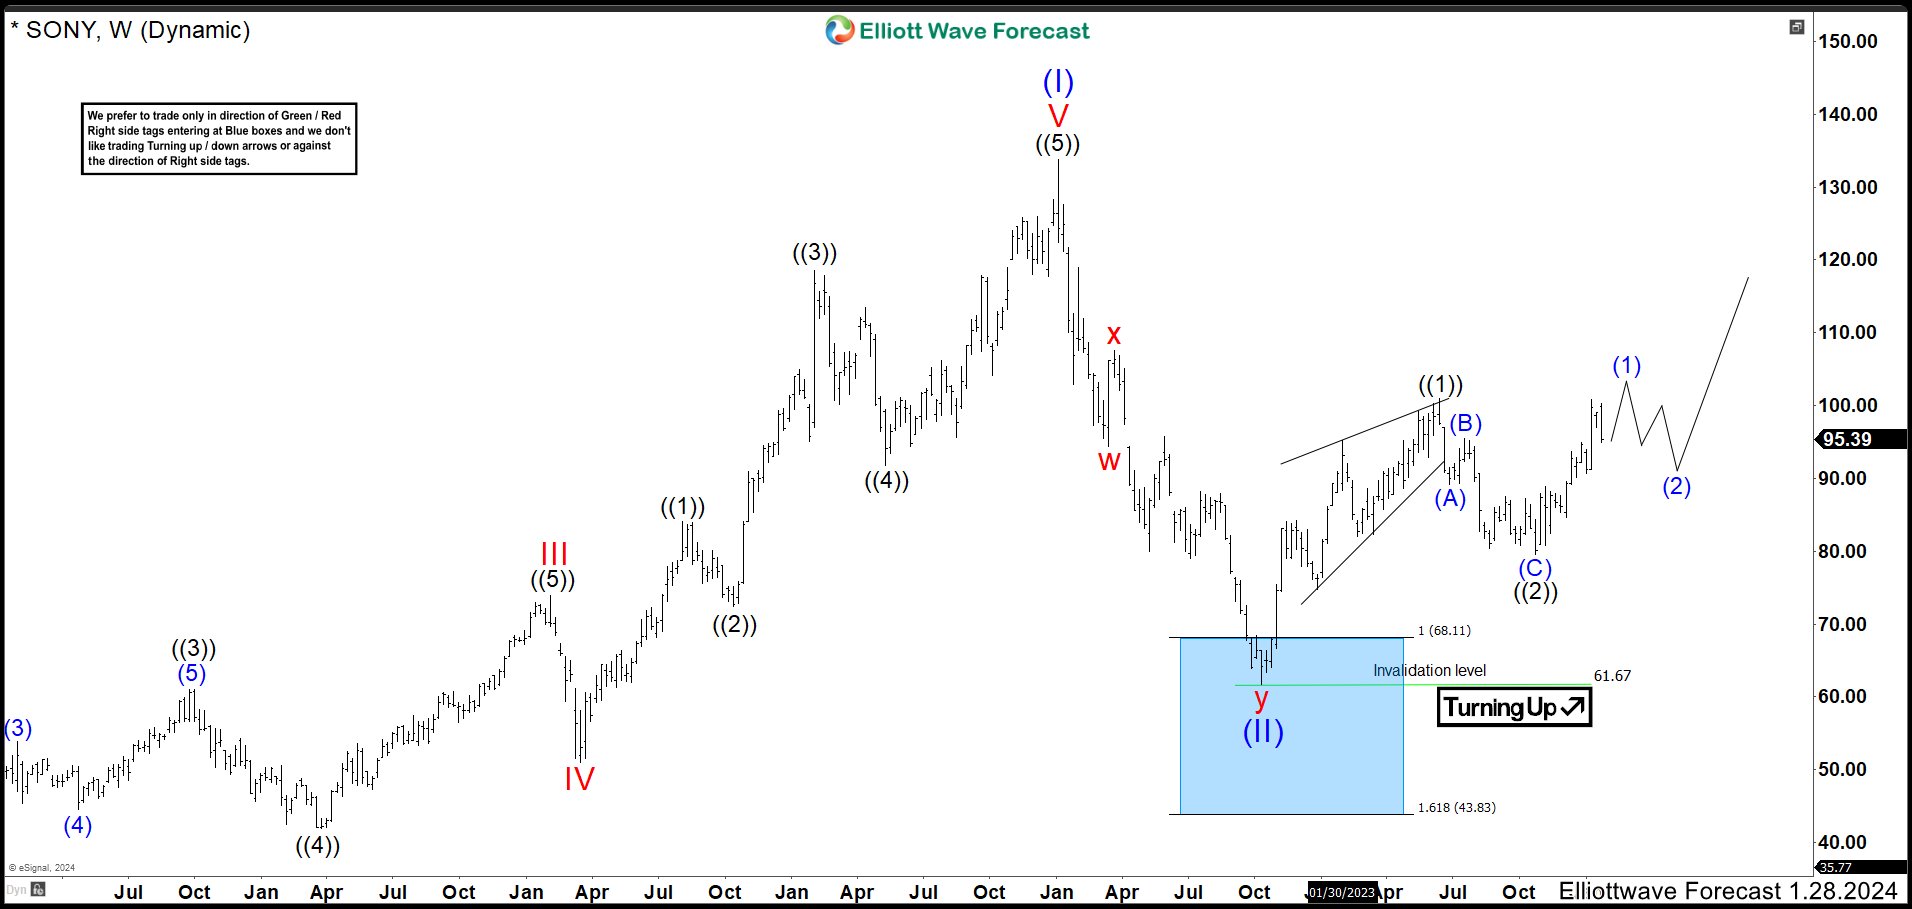
In the chart above, shows how SONY ended a leading diagonal structure at 100. 94 high and we called wave ((1)). Then a pullback took a part in 3 swings ending wave ((2)) at 79.62 low. The stock rallied as expected, as price action stays above 79.62 low, the market should continue to the upside. Currently, we are looking to break 100.94 high for the market to create an incomplete bullish sequence. In that way, we could see the wave (1) ended soon and SONY would enter in a correction of 3, 7 or 11 swings lower as wave (2) before resuming the rally.
Source: https://elliottwave-forecast.com/stock-market/sony-correction-end-bullish/