
Hello everyone. In today’s article, we will look at the past performance of the 1H Hour Elliott Wave chart of American Airlines Group Inc. ($AAL). The rally from 1.03.2024 low at $12.89 unfolded as 5 waves impulse. So, we expected the pullback to unfold in 3 swings and find buyers again. We will explain the structure & forecast below:
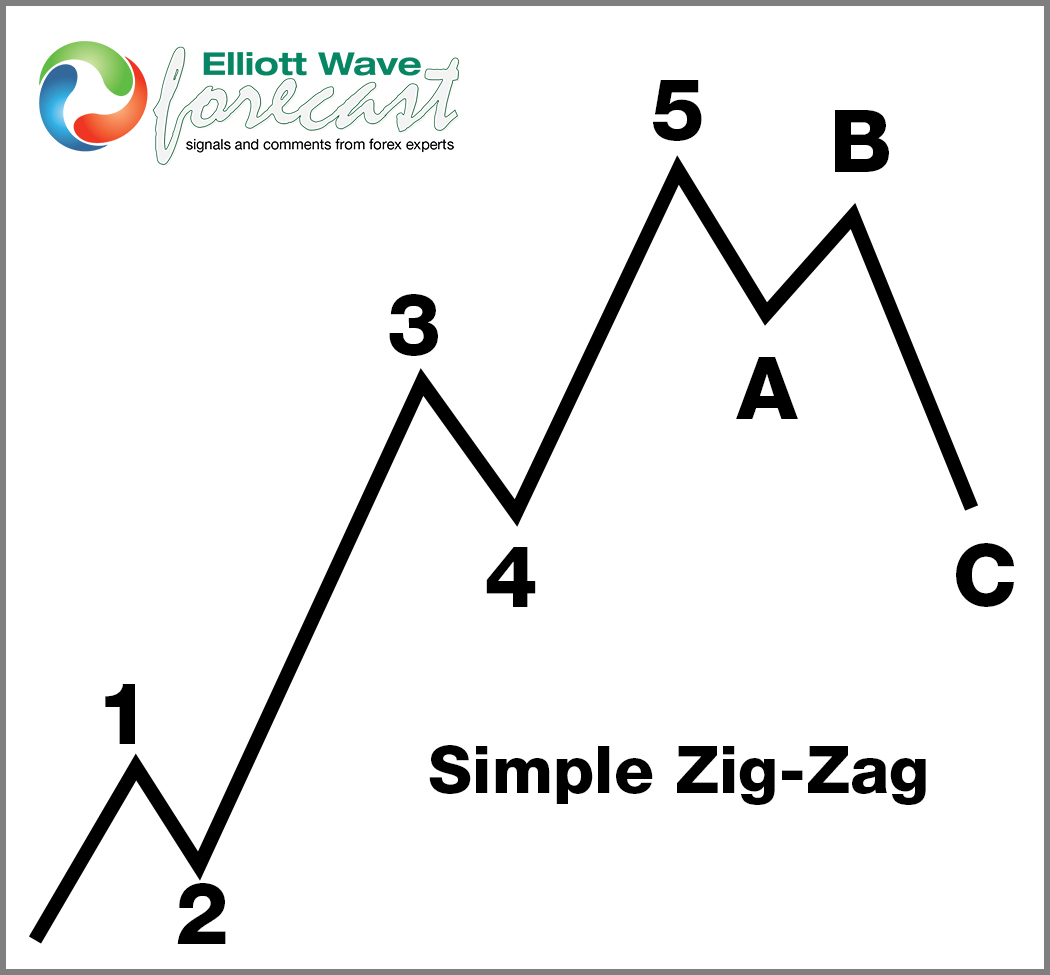
Zigzag (ABC) Corrective Structure
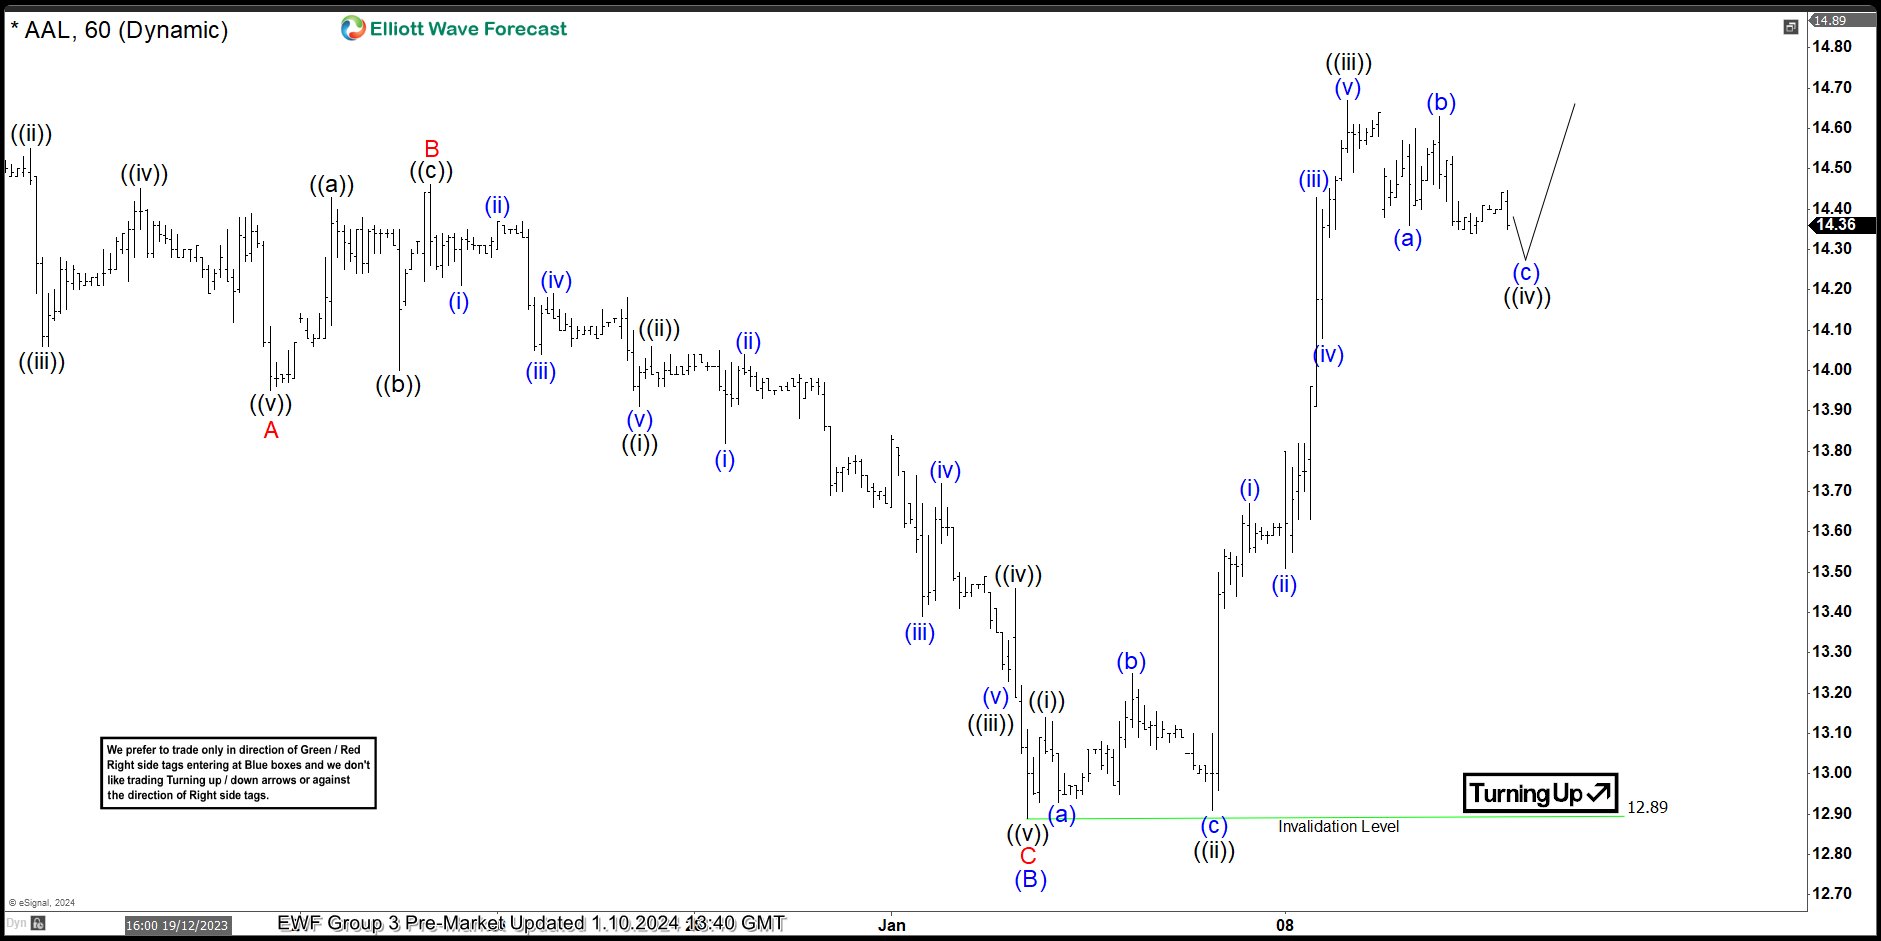
$AAL 1H Elliott Wave Chart 1.10.2024:
Here is the 1H Elliott Wave count from 1.10.2024. We expected the pullback to find buyers against 1.03.2024 low at $12.89 in a 3 swing structure (ABC).
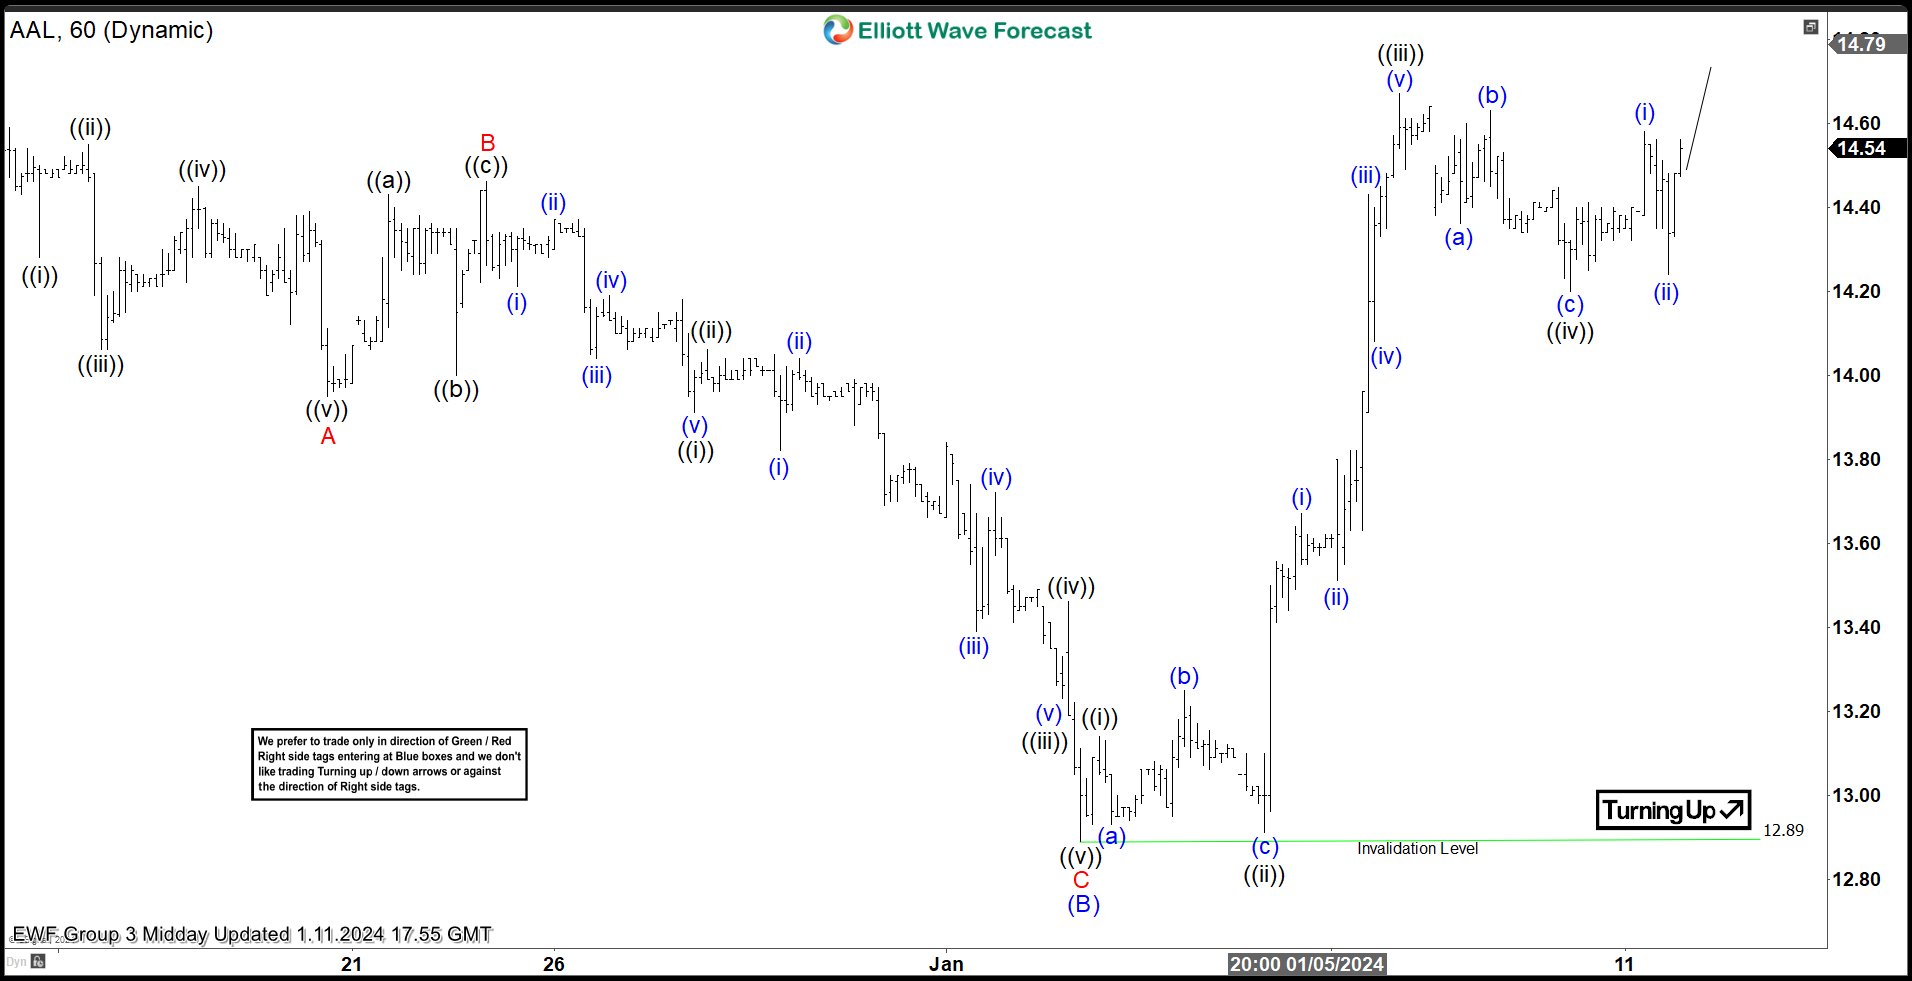
$AAL 1H Elliott Wave Chart 1.11.2024:
Here is the next day 1H update, showing the bounce taking place as expected. The stock reacted higher after doing a Zigzag correction allowing longs to get a risk free position.