
Hello fellow traders. In this technical article we’re going to take a look at the Elliott Wave charts charts of ES_F (E-mini S&P) published in members area of the website. As our members know ES_F is showing impulsive bullish sequences in the cycle from the 4124.4 low. Recently ES made 3 waves pull back in wave ((iv)) black. The futures found buyers and made rally toward new highs as expected . In further text we’re going to explain the Elliott Wave pattern and forecast.
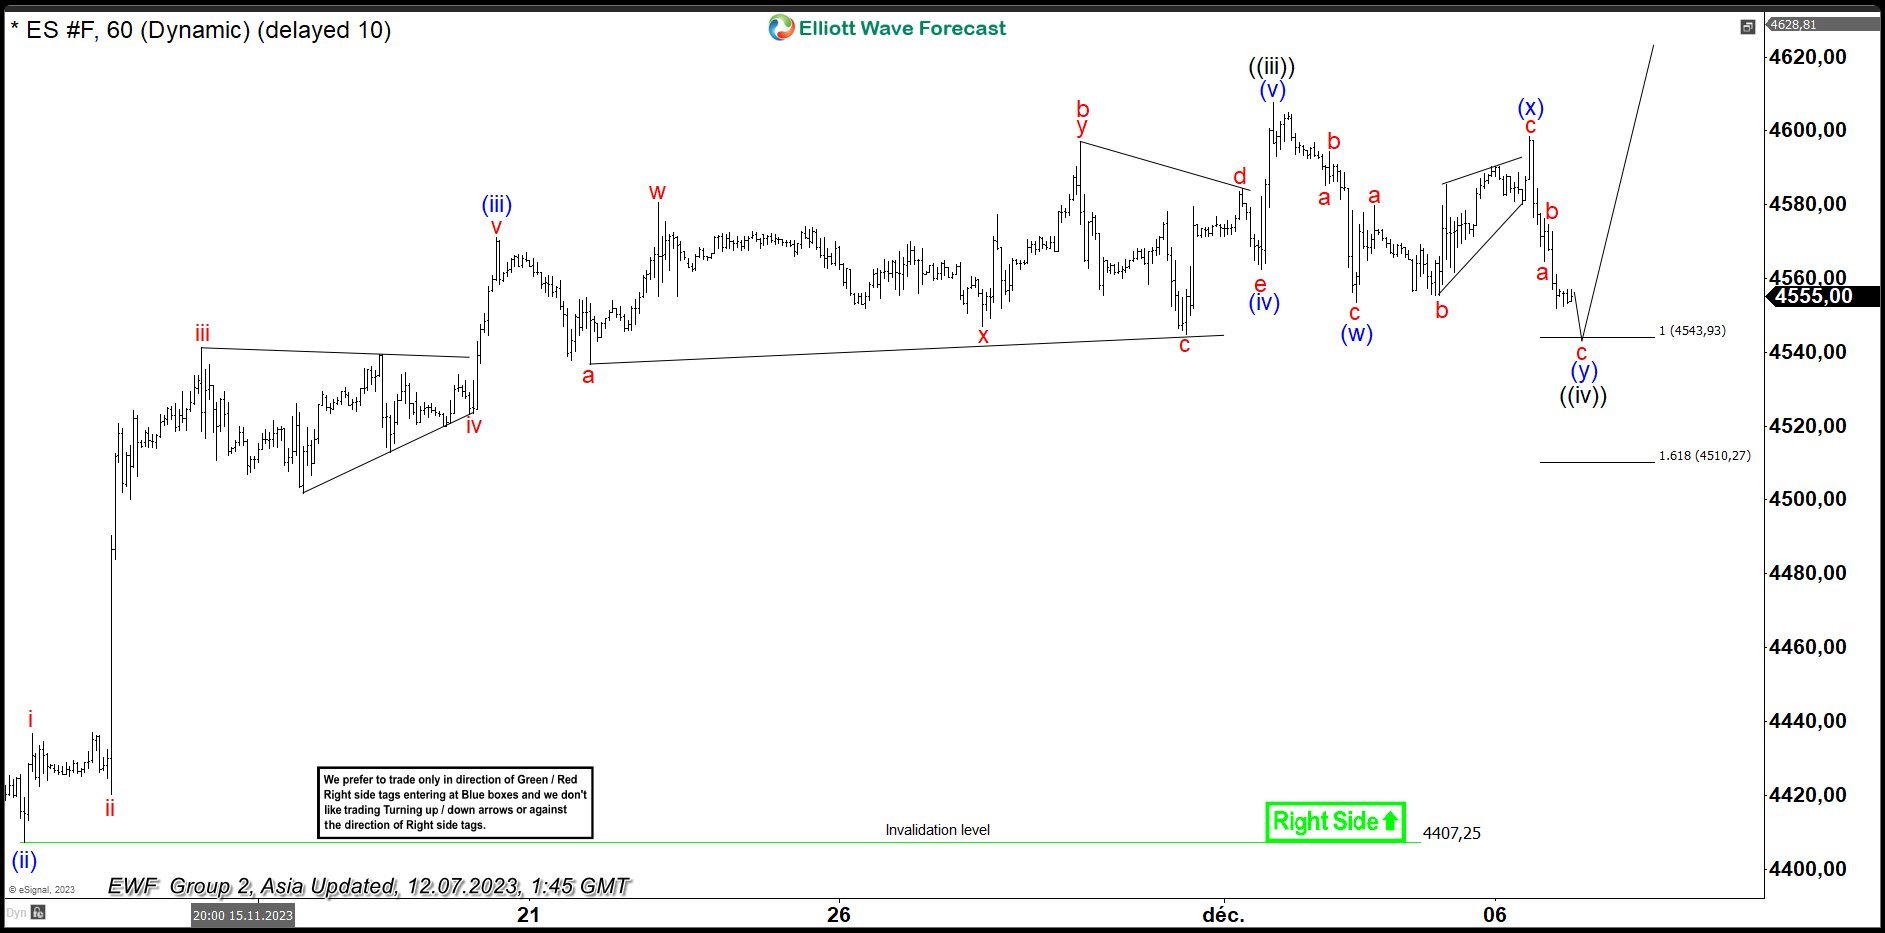
ES_F H1 Update 12.07.2023
ES_F is doing correction wave ((iv)). The structure still looks incomplete at the moment when we still could be trading in wave (y) of potential double three pattern. We see possibility of price making extension down toward 4543.9-5410.2 area ( buyers zone) before turn happens. As overall view is bullish, we don’t recommend selling and favor the long side. We expect ES Futures to make a rally toward new highs ideally.
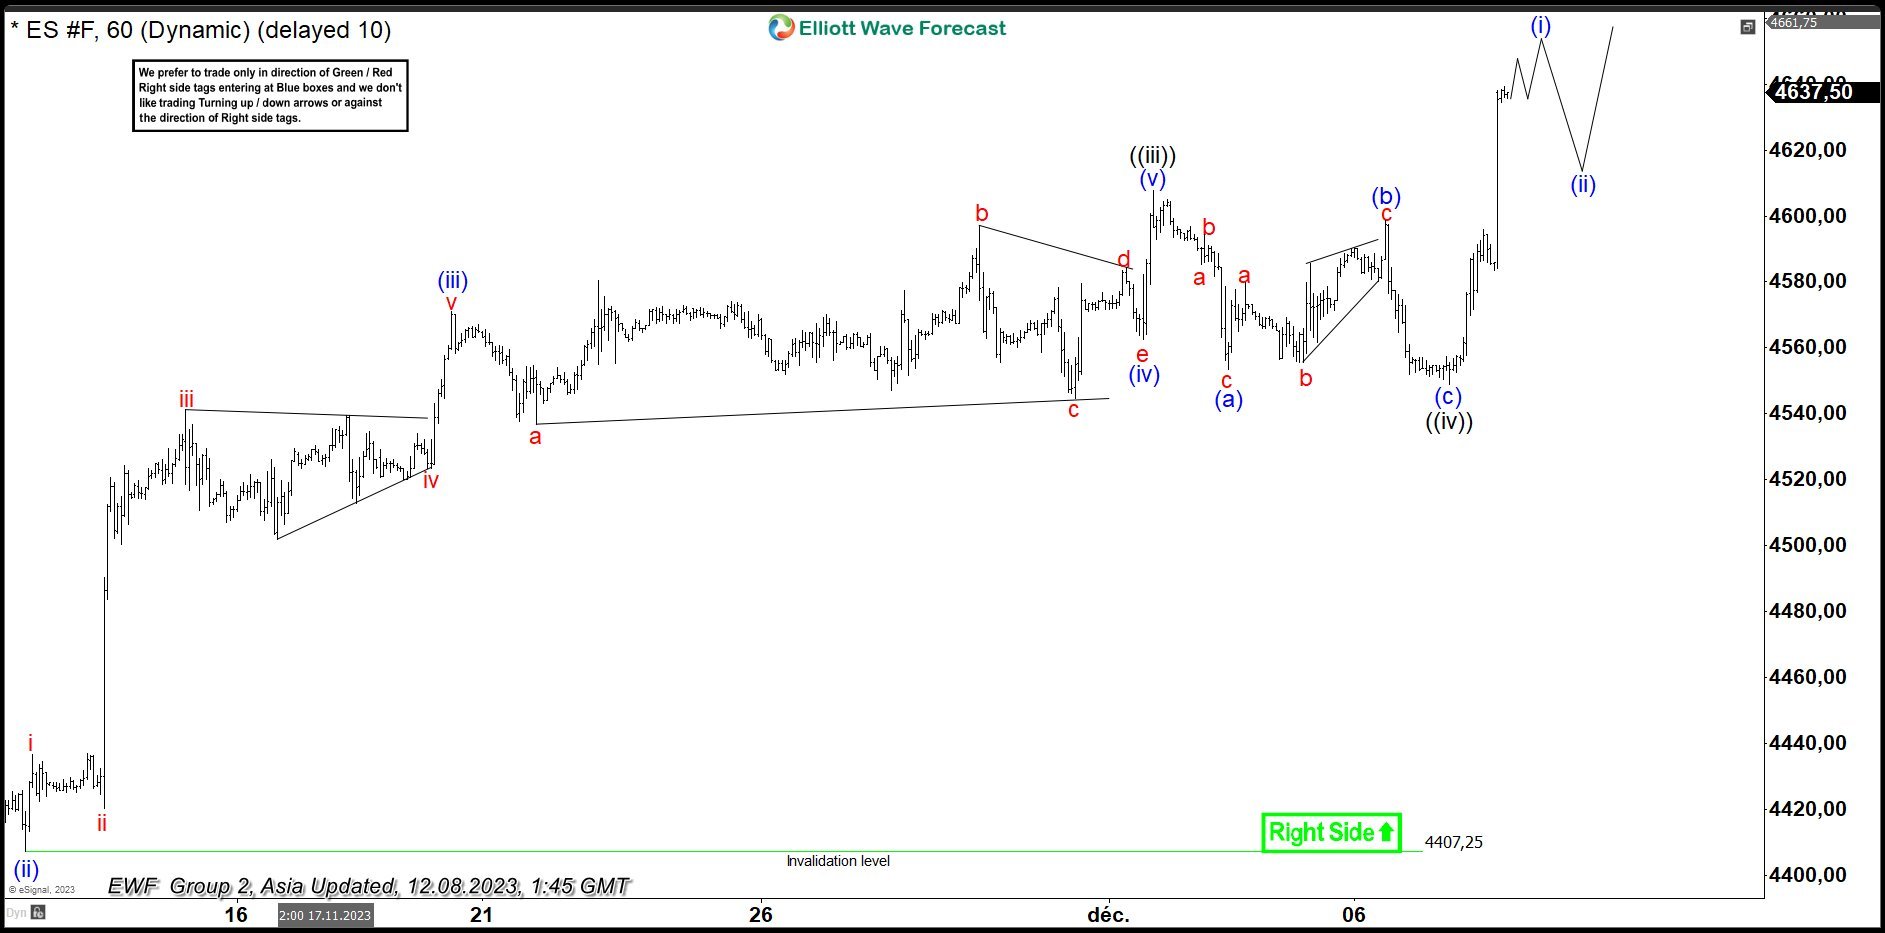
ES_F H1 Update 12.08.2023
ES Futures completed wave ((iv)) recovery early at 4548.7 low. It missed to reach proposed buyers zone at 4543.9-5410.2. We got rally in ((v)) breaking toward new highs as expected. As far as the pivot at 4548.7 low holds, we can see more short term strength within the same cycle.
Keep in mind that market is dynamic and presented view could have changed in the mean time. You can check most recent charts with target levels in the membership area of the site. Best instruments to trade are those having incomplete bullish or bearish swings sequences. We put them in Sequence Report and best among them are shown in the Live Trading Room
New to Elliott Wave ? Check out our Free Elliott Wave Educational Web Page and download our Free Elliott Wave Book.
Source: https://elliottwave-forecast.com/stock-market/es_f-sp-elliott-wave-3-waves-pull-back/