
Hello fellow traders. In this technical article we’re going to take a look at the Elliott Wave charts charts of NIKKEI Futures published in members area of the website. As our members know NIKKEI Futures has recently made pull back that has unfolded as Elliott Wave Double Three Pattern. It made clear 7 swings from the November 20th peak and completed correction right at the Equal Legs zone( Blue Box Area) . In further text we’re going to explain the Elliott Wave pattern and trading setup.
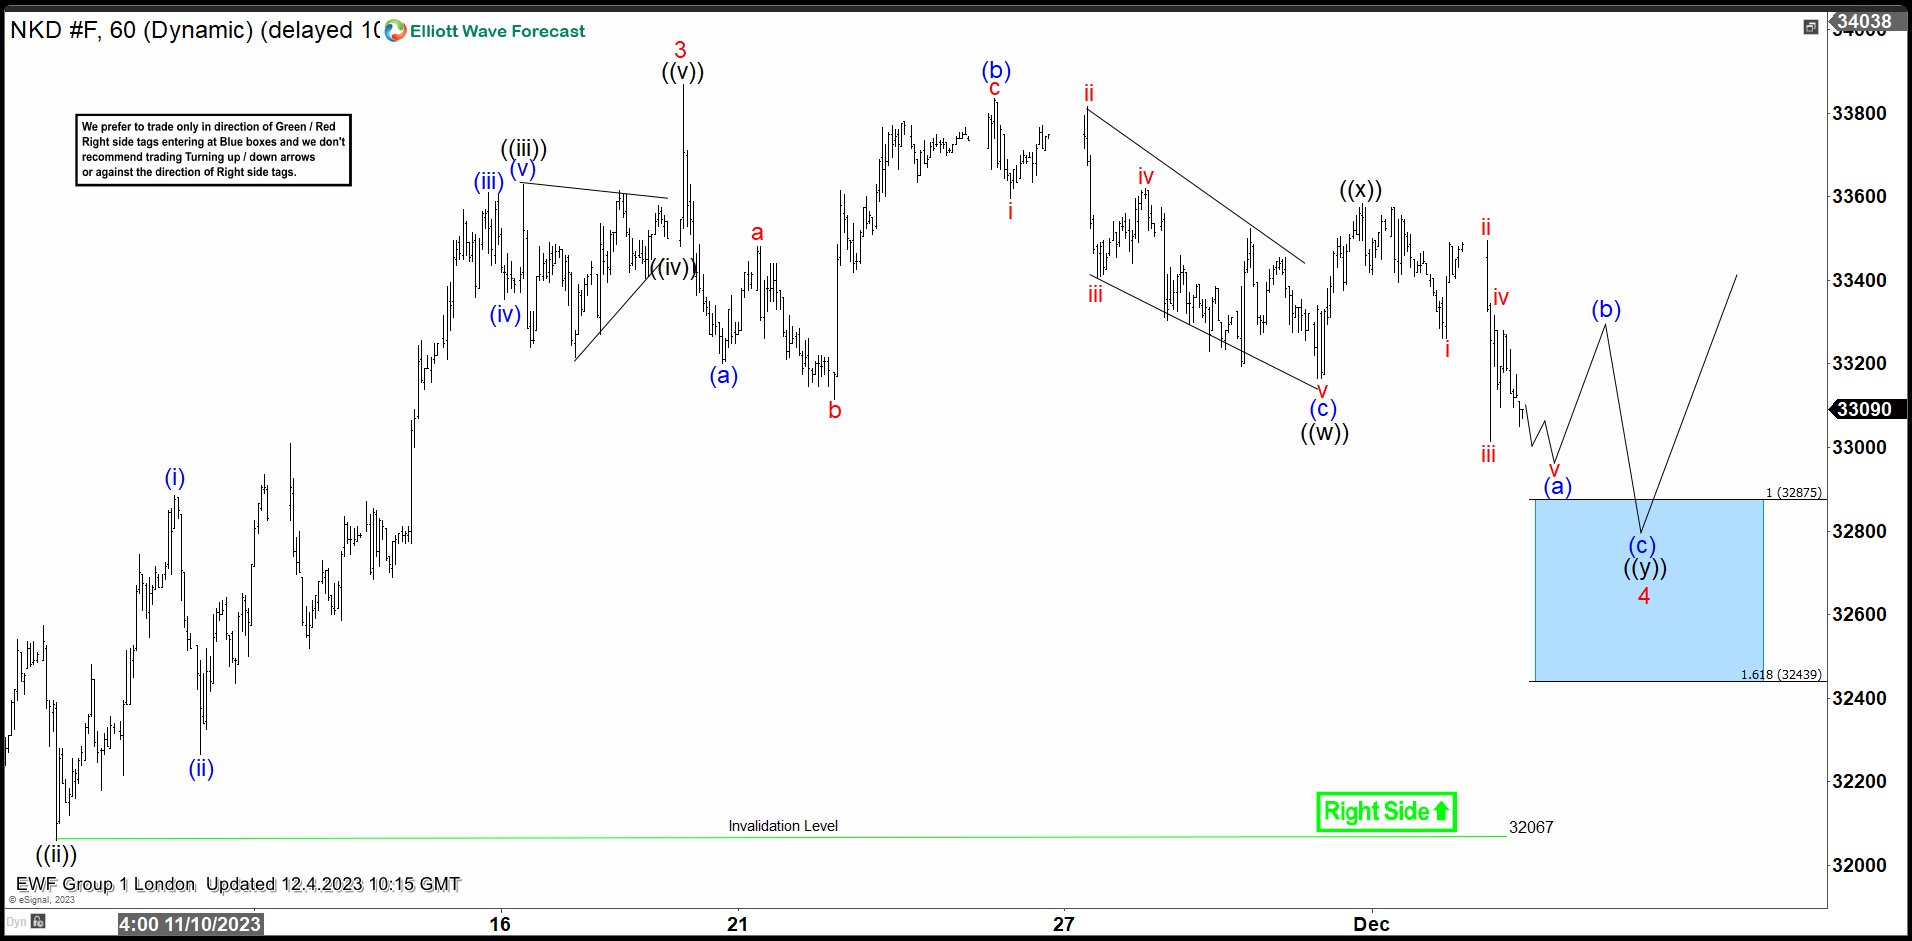
NIKKEI Elliott Wave 1 Hour Chart 12.04.2023
NIKKEI is doing correction that is unfolding as a 7 swings pattern. Pull back has ((w))((x))((y)) labeling. The price structure is incomplete at the moment, calling for a further weakness in near term toward : 32875-32439. We don’t recommend selling Nikkei and prefer the long side from the marked Blue Box ( buying zone). Once Nikkei reaches our buying area, it should ideally make either rally toward new highs or in 3 waves bounce alternatively. Once bounce reaches 50 Fibs against the ((x)) black high, we will make long position risk free ( put SL at BE) and take partial profits.
Official trading strategy on How to trade 3, 7, or 11 swing and equal leg is explained in details in Educational Video, available for members viewing inside the membership area.
Quick reminder on how to trade our charts :
Red bearish stamp+ blue box = Selling Setup
Green bullish stamp+ blue box = Buying Setup
Charts with Black stamps are not tradable. 🚫
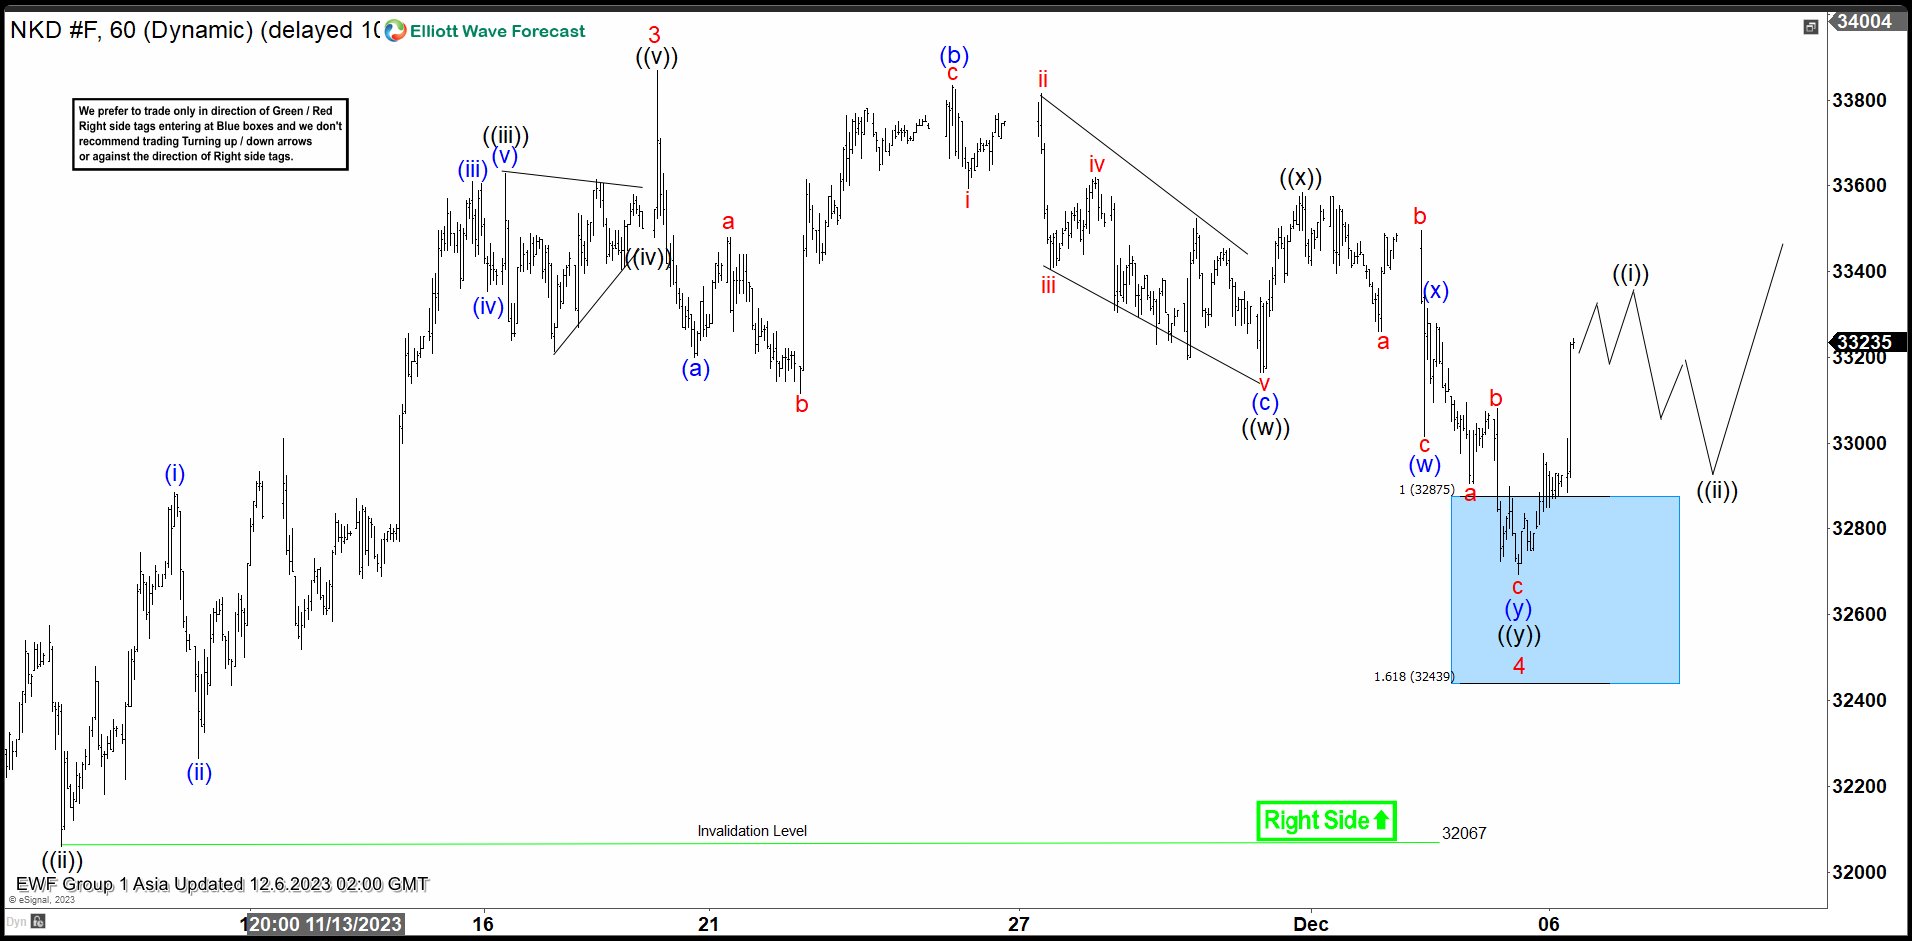
NIKKEI Elliott Wave 1 Hour Chart 12.06.2023
NIKKEI made extension toward our buying zone at : 32875-32439. The futures found buyers at the blue box as expected and we got good reaction from there. Bounce already reached 50 fibs against the ((x)) black connector which confirms cycle from the peak is done. Consequently, any long positions from the equal legs area should be risk free by now. As far as the price stays above 32700 low, we can see further strength in Nikkei.
Keep in mind that market is dynamic and presented view could have changed in the mean time. You can check most recent charts with target levels in the membership area of the site. Best instruments to trade are those having incomplete bullish or bearish swings sequences. We put them in Sequence Report and best among them are shown in the Live Trading Room
New to Elliott Wave ? Check out our Free Elliott Wave Educational Web Page and download our Free Elliott Wave Book.
Source: https://elliottwave-forecast.com/trading/nikkei-nkd_f-found-buyers-blue-box/