
Hello fellow traders. In this technical article we’re going to take a quick look at the Elliott Wave charts of SPX published in membership area of the website. As our members know, S&P500 is trading within the cycle from the October’s 3492.7 low, which is unfolding as 5 waves structure. Recently we got 3 waves pull back which found buyers right at equal legs area as we expected. In the further text we are going to explain the Elliott Wave Forecast
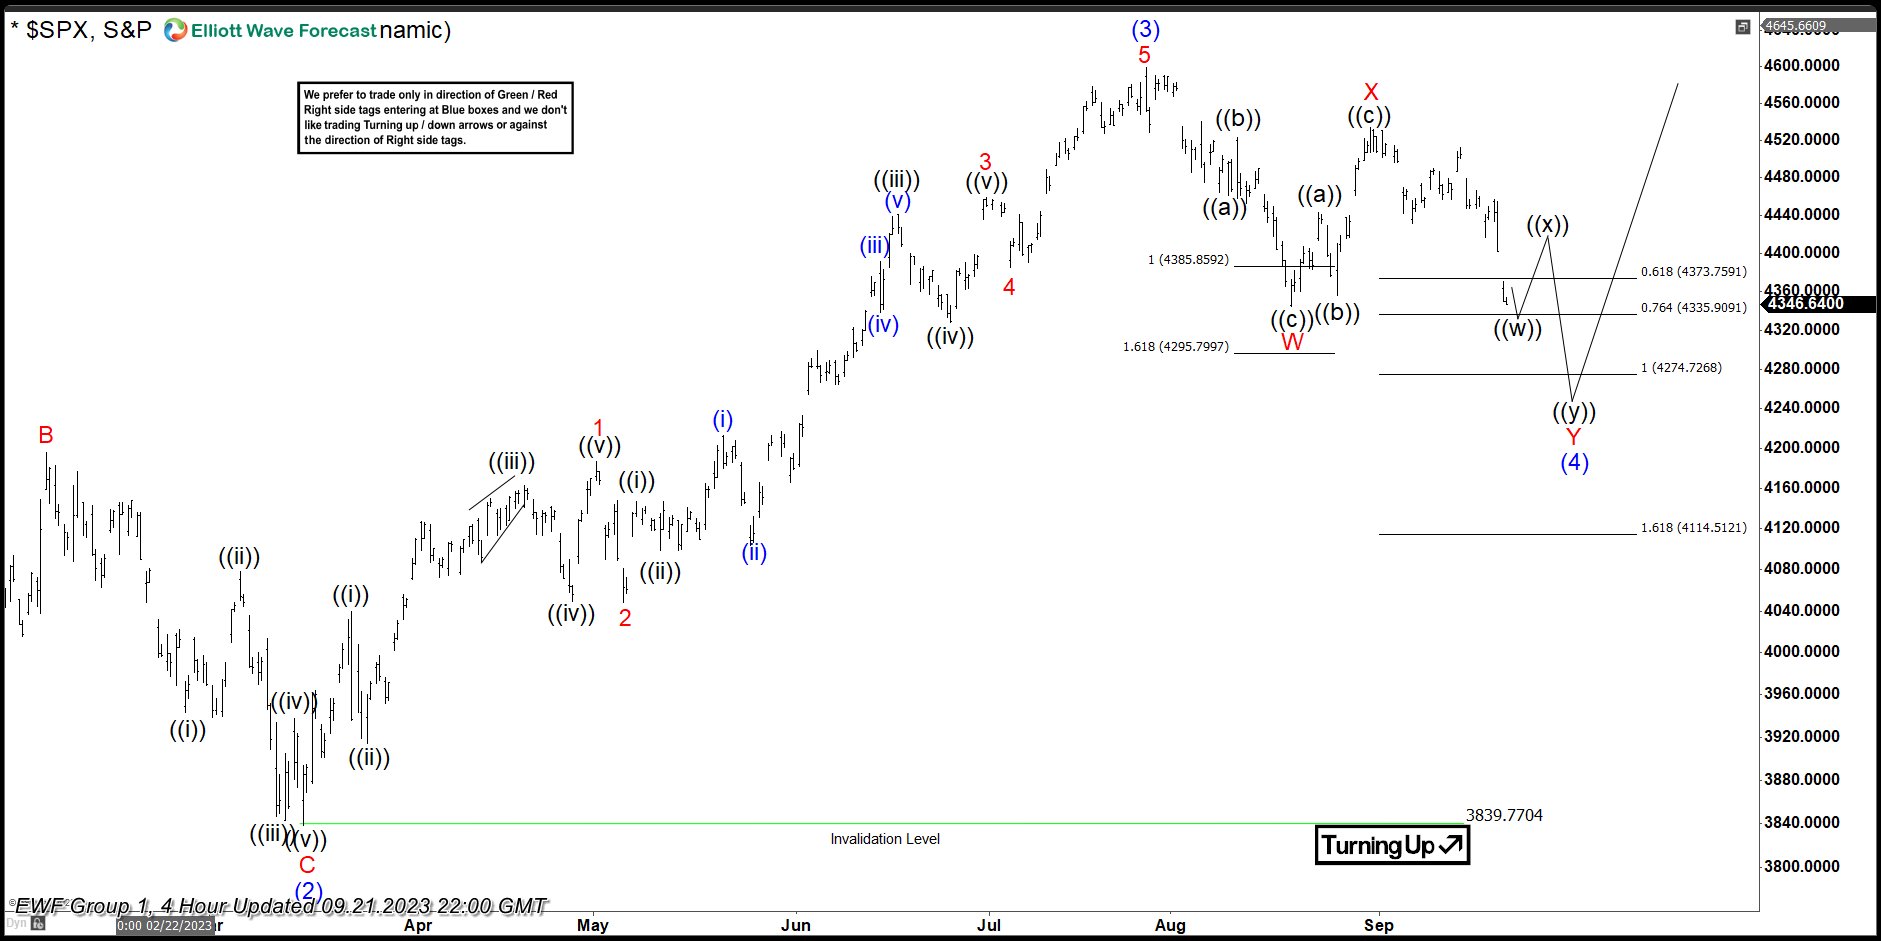
SPX 4h Elliott Wave Analysis 09.21.2023
SPX is doing wave (4) blue pull back. The index is correcting the cycle from the 3839.7 low. Pull back looks incomplete at the moment. We expect another leg down toward 4274.7-4114.5 area to complete the correction.
Reminder: You can learn about Elliott Wave Rules and Patterns at our Free Elliott Wave Educational Web Page.
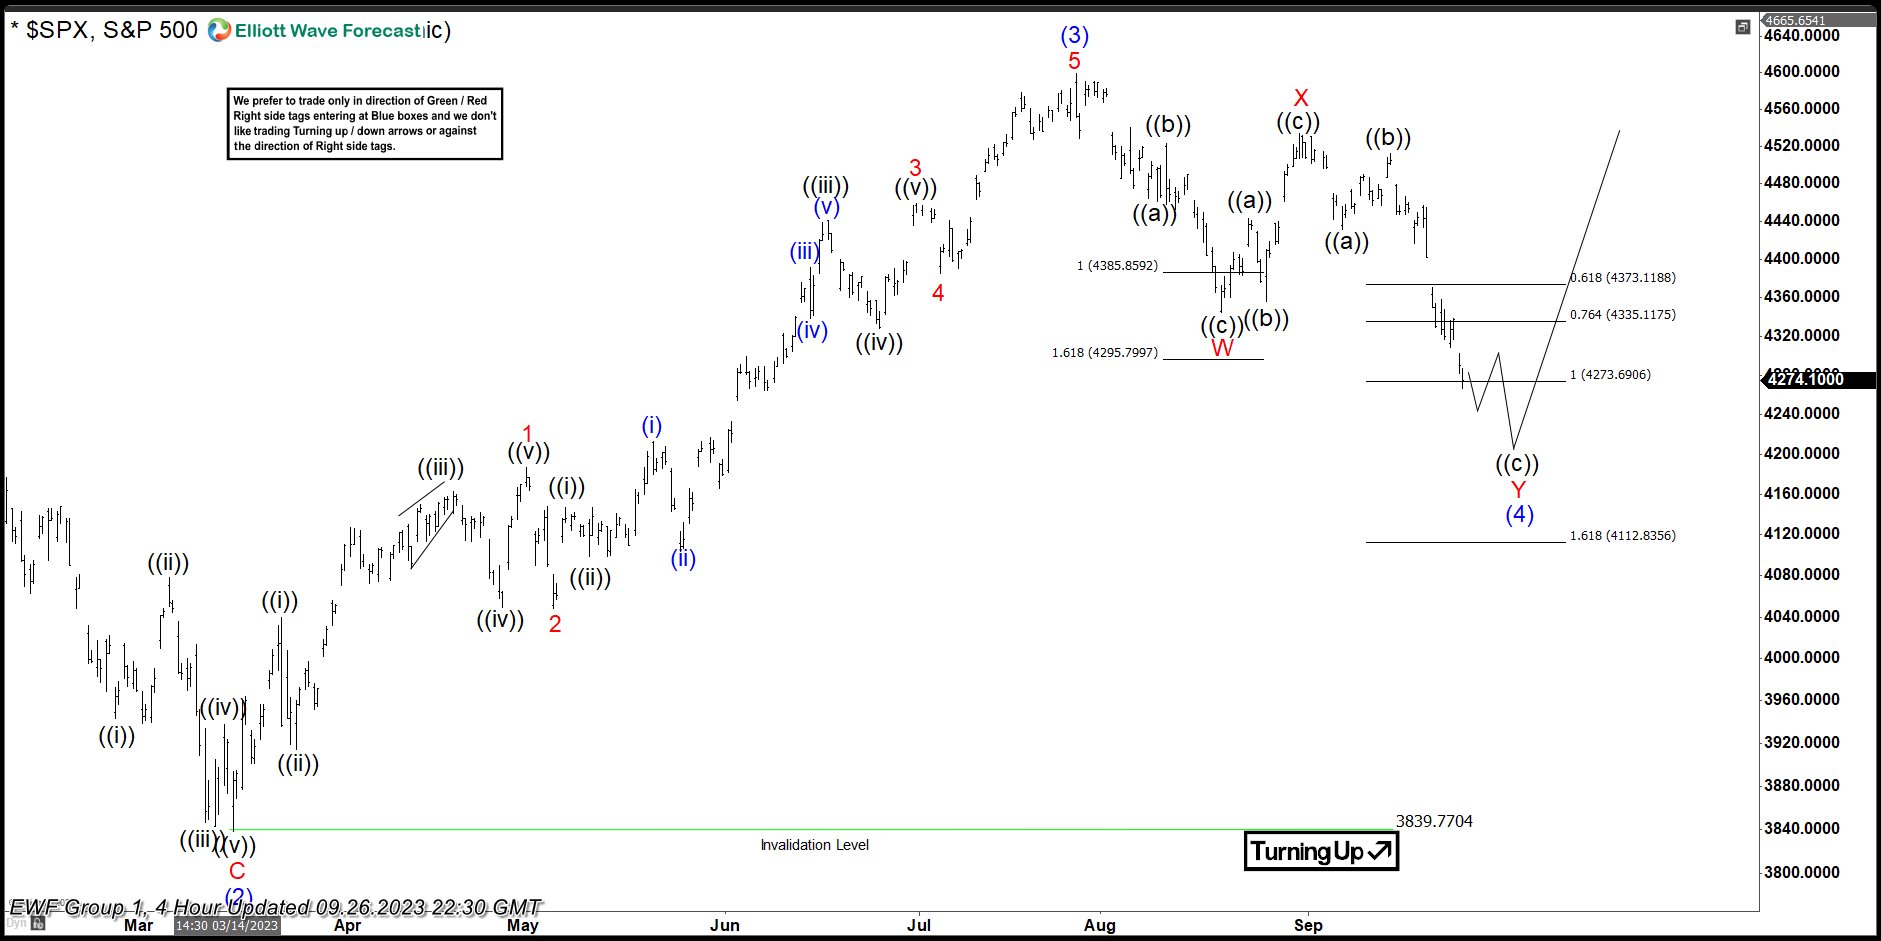
SPX 4h Elliott Wave Analysis 09.26.2023
SPX made extension down and reached the extreme zone- equal legs area as expected. We see possibility of SPX making shallow bounce and another leg down within buyers zone, which will allow rest of the Indices to reach their extremes. At the marked zone SPX should ideally find buyers for further rally in wave (5) blue or for a 3 waves bounce at least.
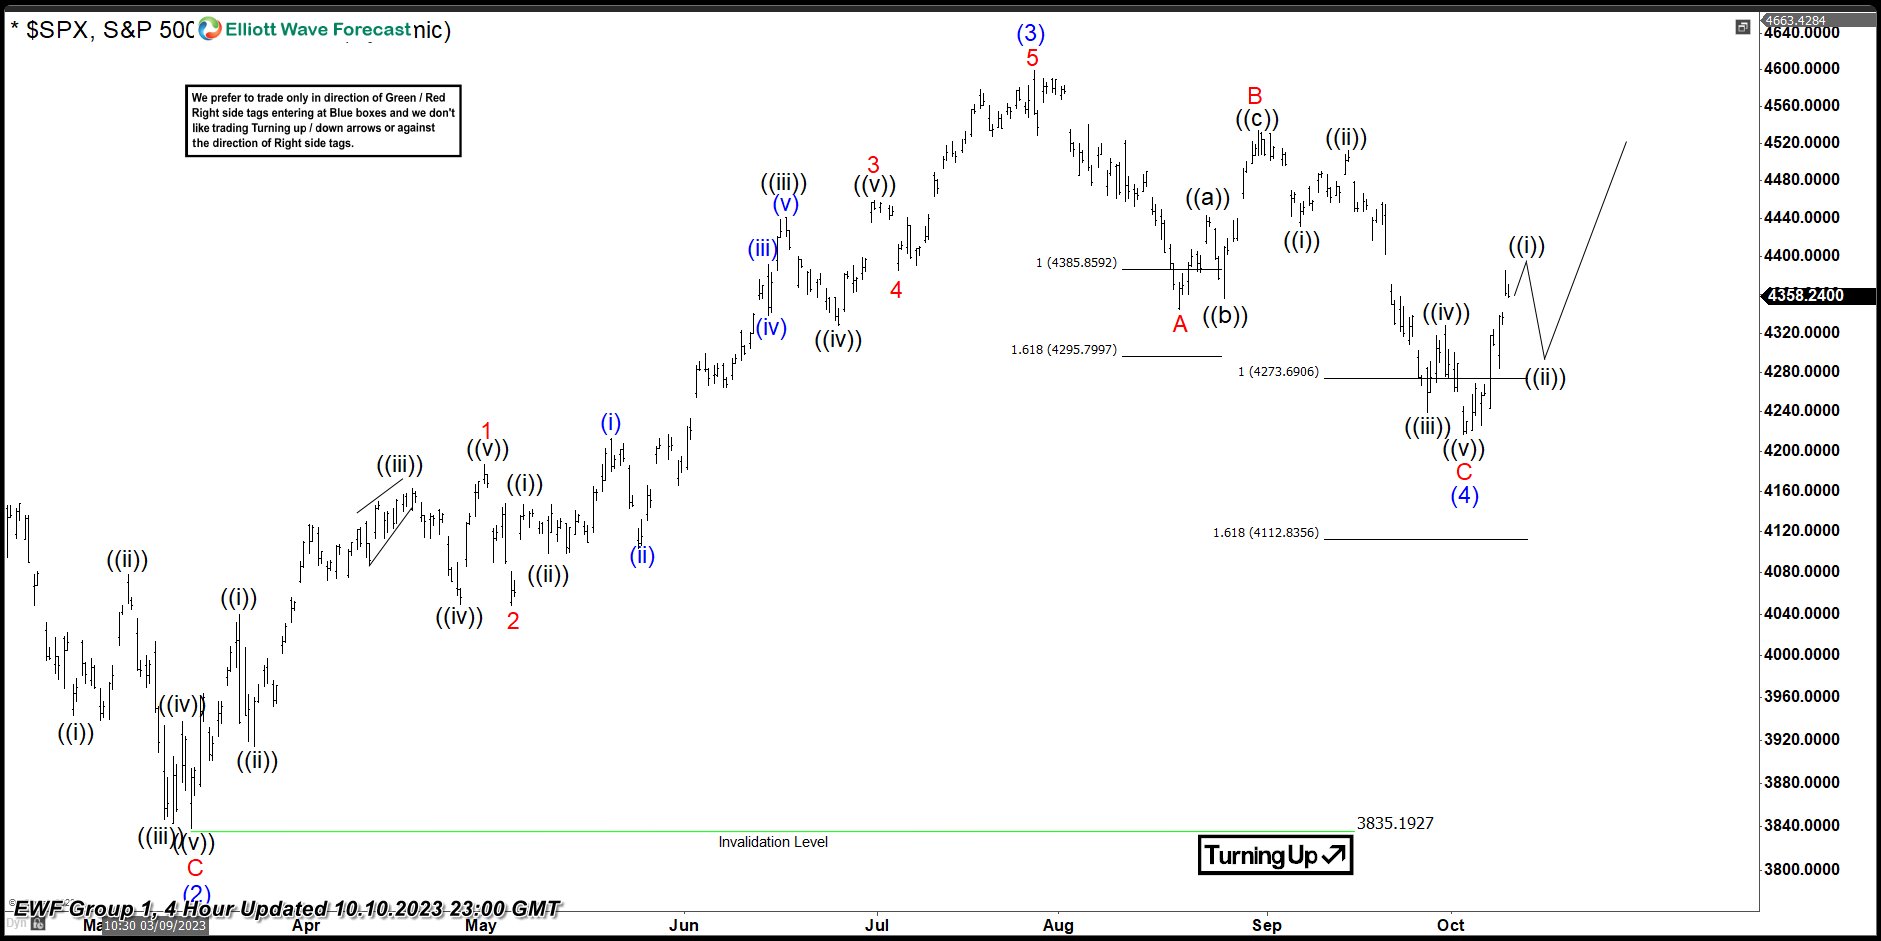
SPX 4h Elliott Wave Analysis 10.10.2023
Buyers appeared at the marked extreme zone 4274.7-4114.5 and we are getting good reaction from there. As far as 4214.67 low holds, SPX should ideally keep trading higher in wave (5) red toward new highs. We need to see break of 07/27 peak to confirm next leg up is in progress.
Keep in mind that market is dynamic and presented view could have changed in the mean time. You can check most recent charts in the membership area of the site. Best instruments to trade are those having incomplete bullish or bearish swings sequences. We put them in Sequence Report and best among them are shown in the Live Trading Room.
Source: https://elliottwave-forecast.com/stock-market/sp500-spx-found-buyers-equal-legs/