
Airbnb is an U.S. American corporation operating an online marketplace for short- and long-term homestays and experiences. Hereby, the company acts as a broker and charges a commission from each booking. Founded in 2008 and headquartered in San Francisco, California, USA, Airbnb can be traded under ticker $ABNB at NASDAQ. There, it is a component of the Nasdaq-100 index.
Airbnb Weekly Elliott Wave Analysis 09.05.2023
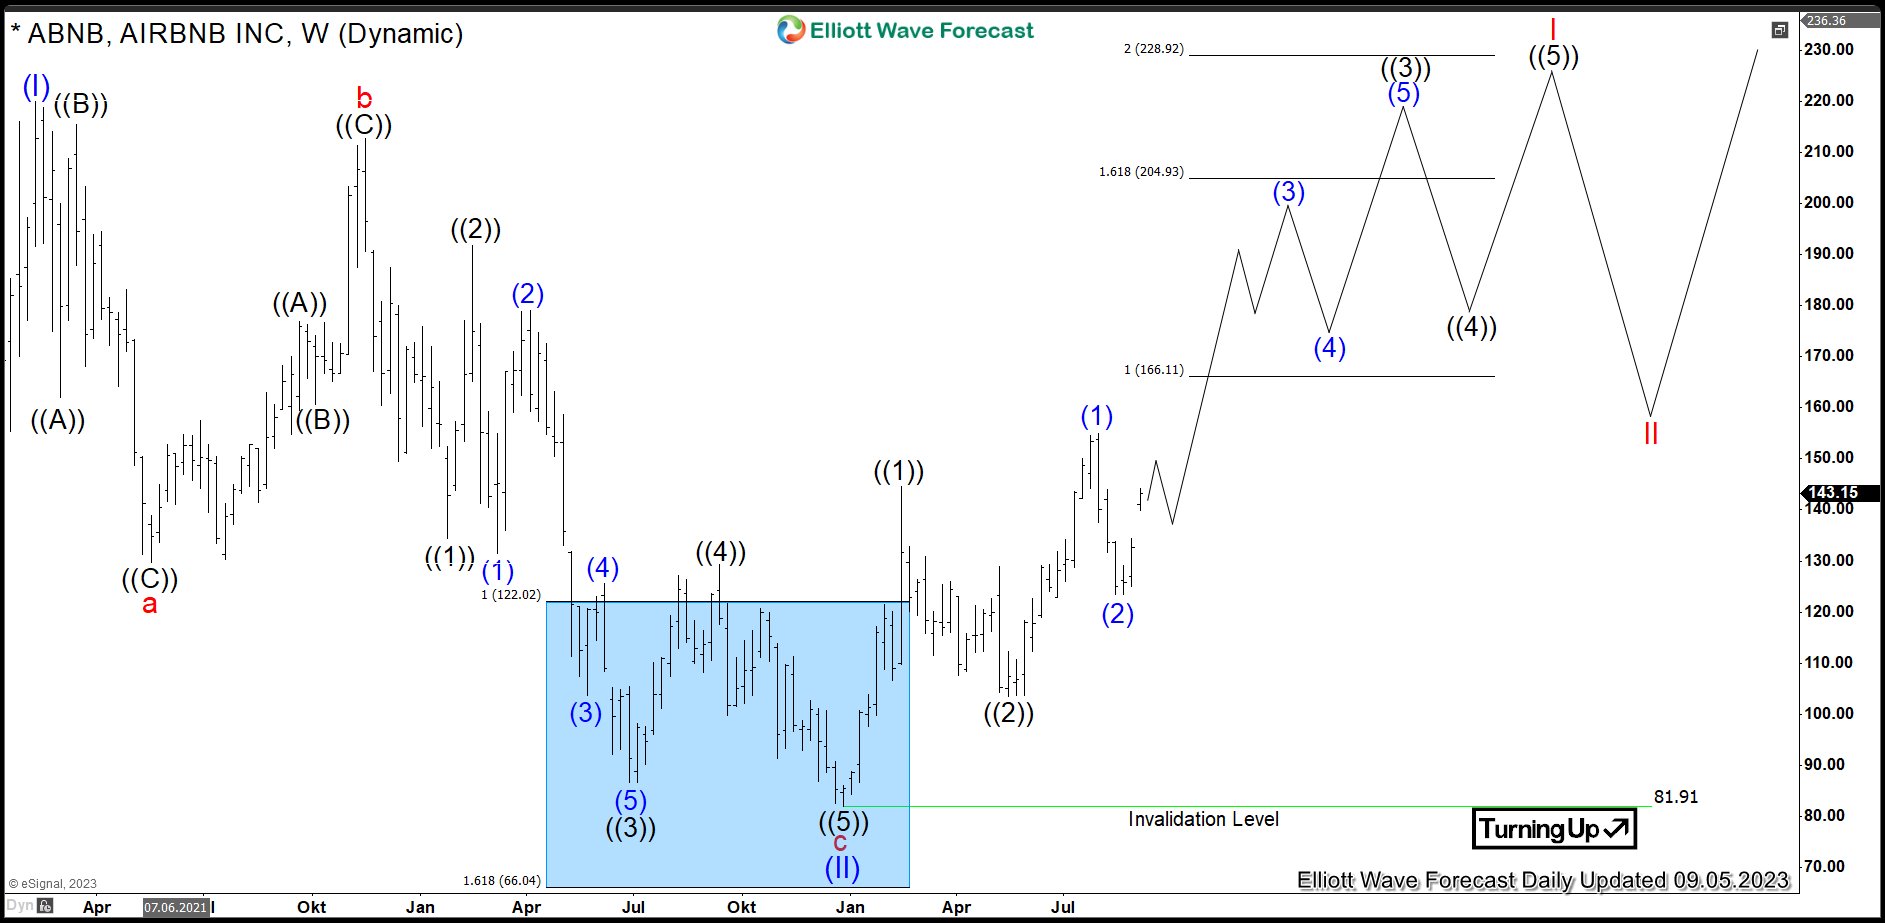
The weekly chart below shows the Airbnb shares $ABNB traded at NASDAQ. From the all-time lows, the stock price is showing a nest and a new bullish cycle in progress. Firstly, initial rally from IPO in blue wave (I) of super cycle degree has ended in February 2021 by printing the all-time highs at $219.94. Secondly, correction lower in blue wave (II) has found bottom in December 2022 at $81.91 lows. Hereby, it shows an Elliott wave regular flat pattern being 3-3-5 structure. Also, red wave c of flat has reached 122.02-66.04 equal legs extension area based on the length of red wave a.
From the December 2022 lows, new cycle in blue wave (III) has started. Break above $219.94 will confirm that. Within blue wave (III), one can see two nests in black waves ((1))-((2)) and blue waves (1)-(2). Soon, acceleration higher should take place within blue wave (3) of black wave ((3)). Hereby, black wave ((3)) can see following targets: $166, $205, $229 and even higher. Investors and traders can be looking to buy short term pullbacks in 3, 7 swings expecting more upside. The target for blue wave ((III)) is towards 300-435 area and even beyond in the long run.
Source: https://elliottwave-forecast.com/stock-market/airbnb-nesting-acceleration/