
Nvidia (NVDA) has been one of the most Technical symbols across the market. The symbol reacted off the Blue Box (High-Frequency). We presented this area to members on 10.2022. The instrument corrected the Grand Super Cycle and was a unique opportunity to buy the trend. As expected, the rally happened and reached the extreme area target at $453.00. This is the profit-taking area where it reaches 100% extension of wave ((I)). Consequently, we know there’s a chance of a pullback and will affect the whole Market.
As we always said at EWF, there are two sides to the trade. Buyers will take profit when reaching a target, which creates a chance for the sellers to enter the market. NVDA has reached the minimum target. As a result, we see choppiness across Indices, Stocks, and ETFs since the stock reached the target. The warning is simple, the stock has reached minimum target and soon a pullback will happen.
This will put a ceiling to the stock market. It will make the rest of the year challenging for the buyers across Indices, Stocks, and ETF’s. The price action of NVDA is very interesting. Even when it is sending the warning of a pullback, it is also showing the future. The rally within the Grand Super Cycle is in three waves, which eliminates the chance of a crash across the market. An impulsive rally should not end in 3 waves. Thus, it offers another buying opportunity across the market which should happen sometimes at the end of 2023 or early 2024.
Here is the Grand Super Cycle Blue Box buying area and target
NVDA Weekly Elliott Wave Chart
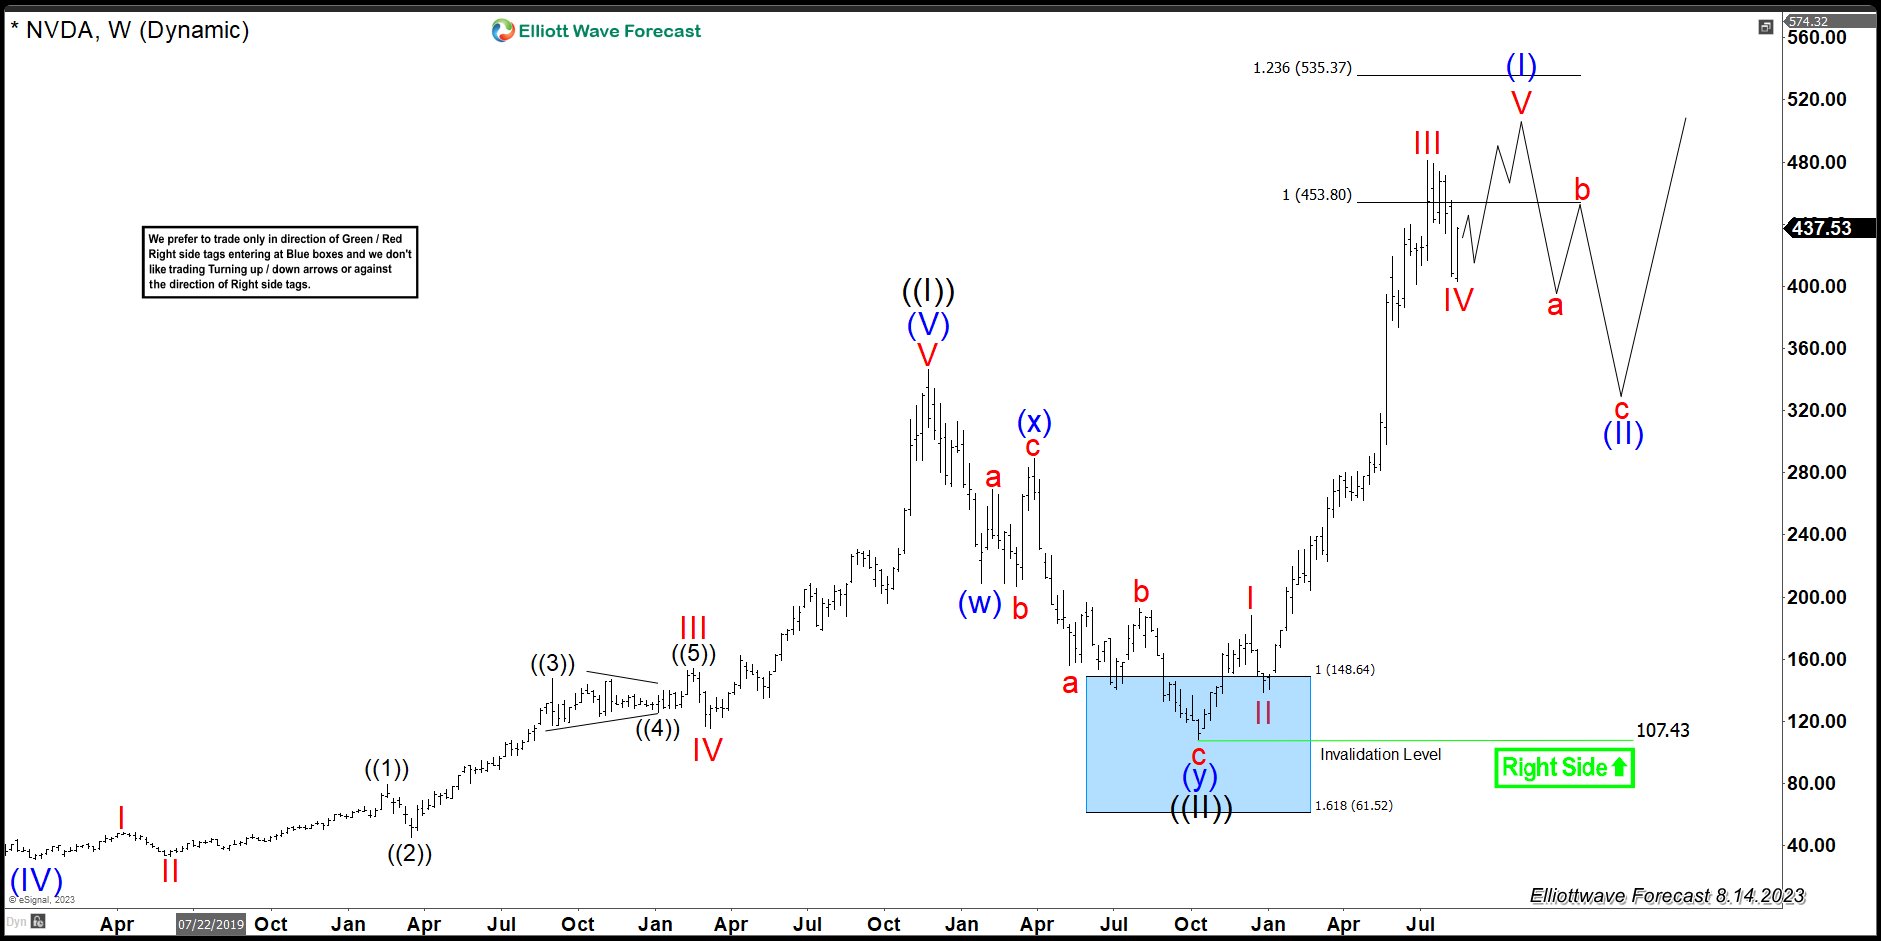
The Elliott Wave Theory is very clear. Three waves do not make a trend. As a result, NVDA has two potential paths. The first path is nesting within the Grand Super Cycle where we are now ending the second wave I. A nest is a series of I-II before the Market trades higher into an acceleration. The following chart shows a nest
Elliott Wave Nesting Structure
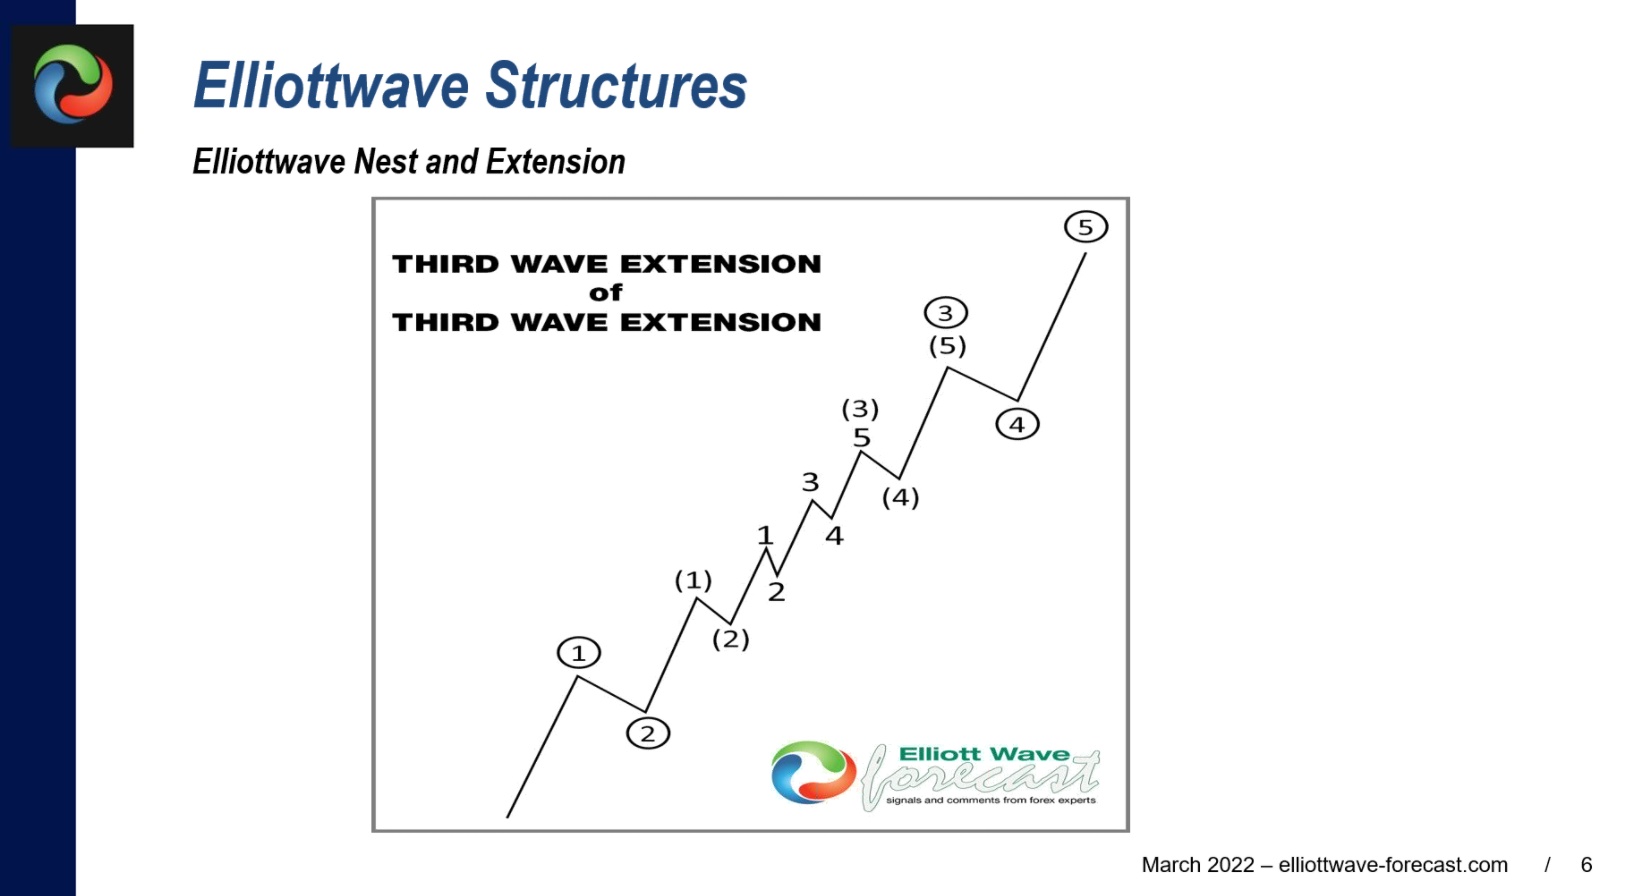
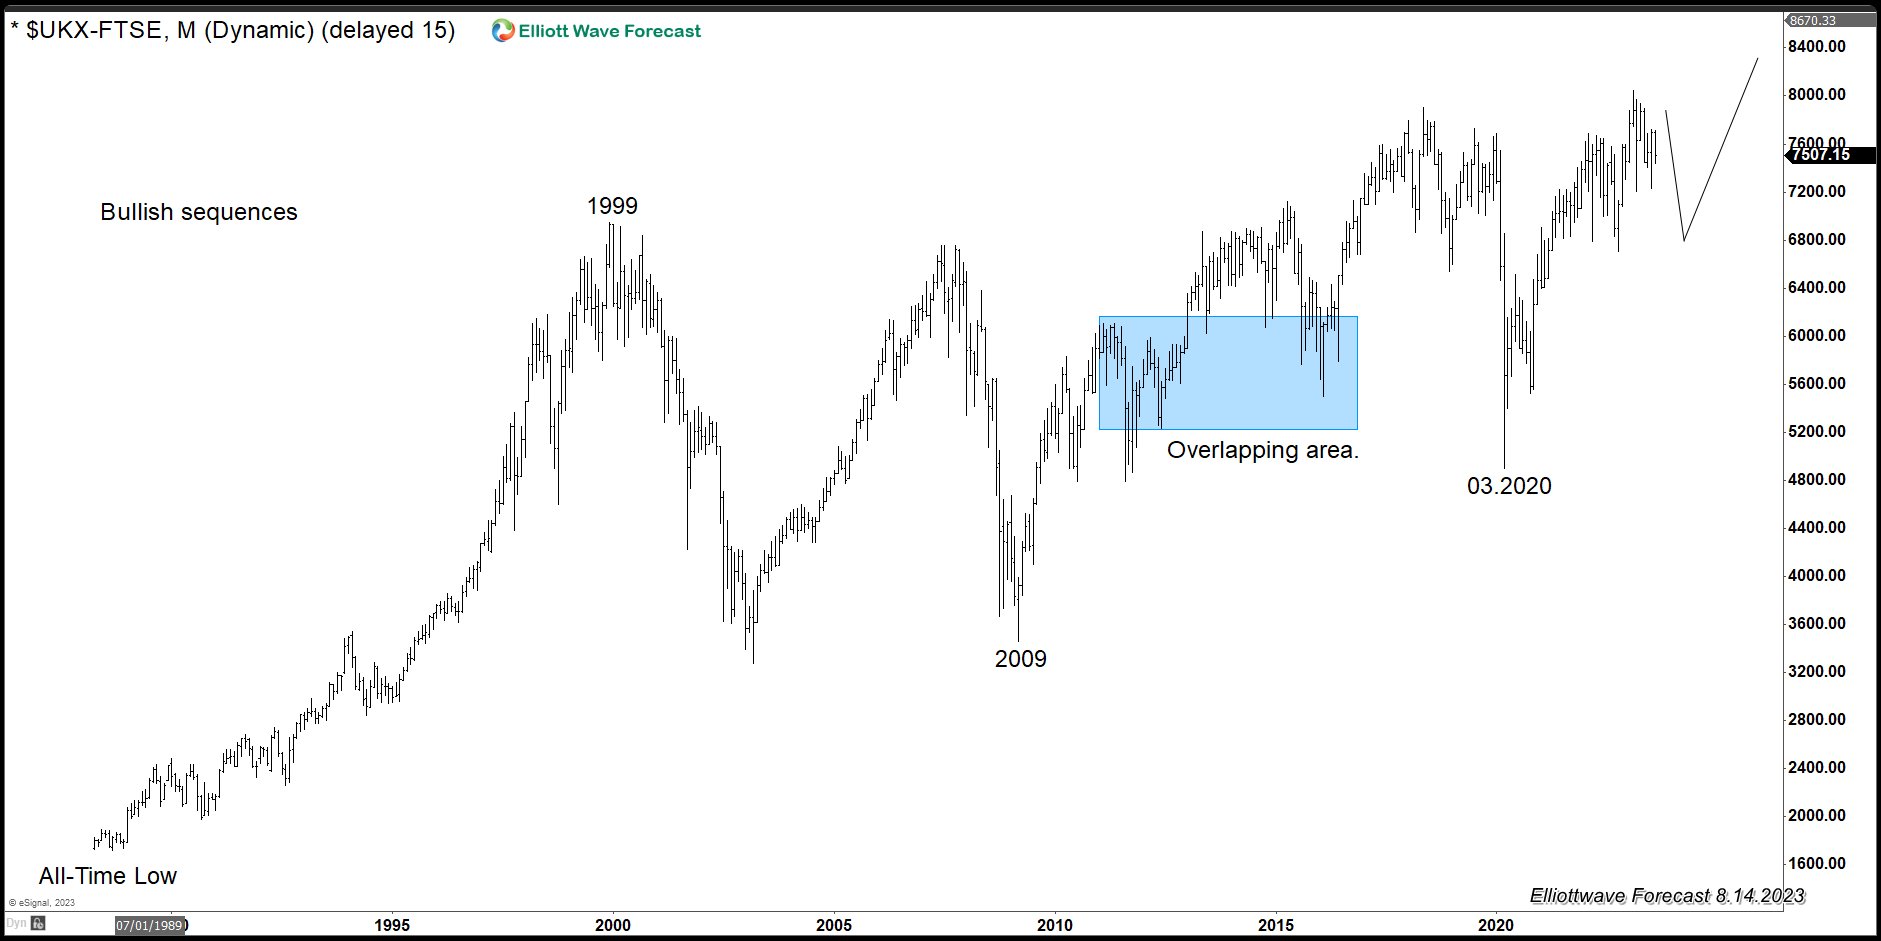
The chart above is what a nest looks like in the Elliott Wave Theory. As we can see, we have a series of I-II in consecutive degrees. It opens with the trend and then ends doing a series of IV-V in successive degrees before the cycle ends. This is the most bullish scenario. It is also the most likely scenario since we see many Indices show overlap within the Grand Super Cycle. For example, $FTSE chart below shows an overlapping area.
$FTSE Monthly Elliott Wave Chart
The other scenario is a simple impulse. In this case, NVDA is ending wave ((III)) and should do a wave ((IV)) and then do another leg higher with the trend. As always, three waves do not make a trend, so NVDA’s three waves off the lows is calling for more upside within the Grand Super Cycle. Consequently, it will support other Indices, Stocks, and ETFs.
The Five wave cycle of the Elliott Wave Theory is shown in the following chart:
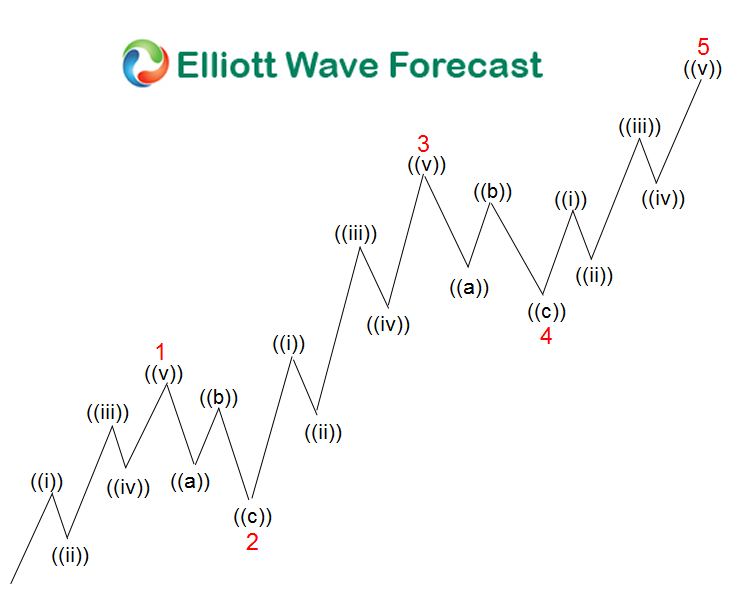
As we can see, it is a sequence of five waves, and now we got three in NVDA. One of the main rules of the Theory is that wave ((III) can not be the shortest, but we can not know that in NVDA now. We need to see the next leg higher, but one thing is for sure, the buyers are in full control. As we can see, NVDA is showing both the short-term and long-term future, and both agree on more upside within the Grand Super Cycle. Therefore fear of a market crash is baseless because the price action supports the buyers.