
In this technical blog, we will look at the past performance of the 4-hour Elliott Wave Charts of GBPCAD. In which, the decline from 03 May 2023 high ended 5 waves in a leading diagonal sequence and made a bounce higher. Therefore, we knew that the structure of GBPCAD is incomplete to the downside & the bounce should get fail in 3, 7, or 11 swings looking for another extension lower to complete the sequence. So, we advised members to sell the bounces in 3, 7, or 11 swings at the equal legs areas. We will explain the structure & forecast below:
GBPCAD 4-Hour Elliott Wave Chart From 6.15.2023
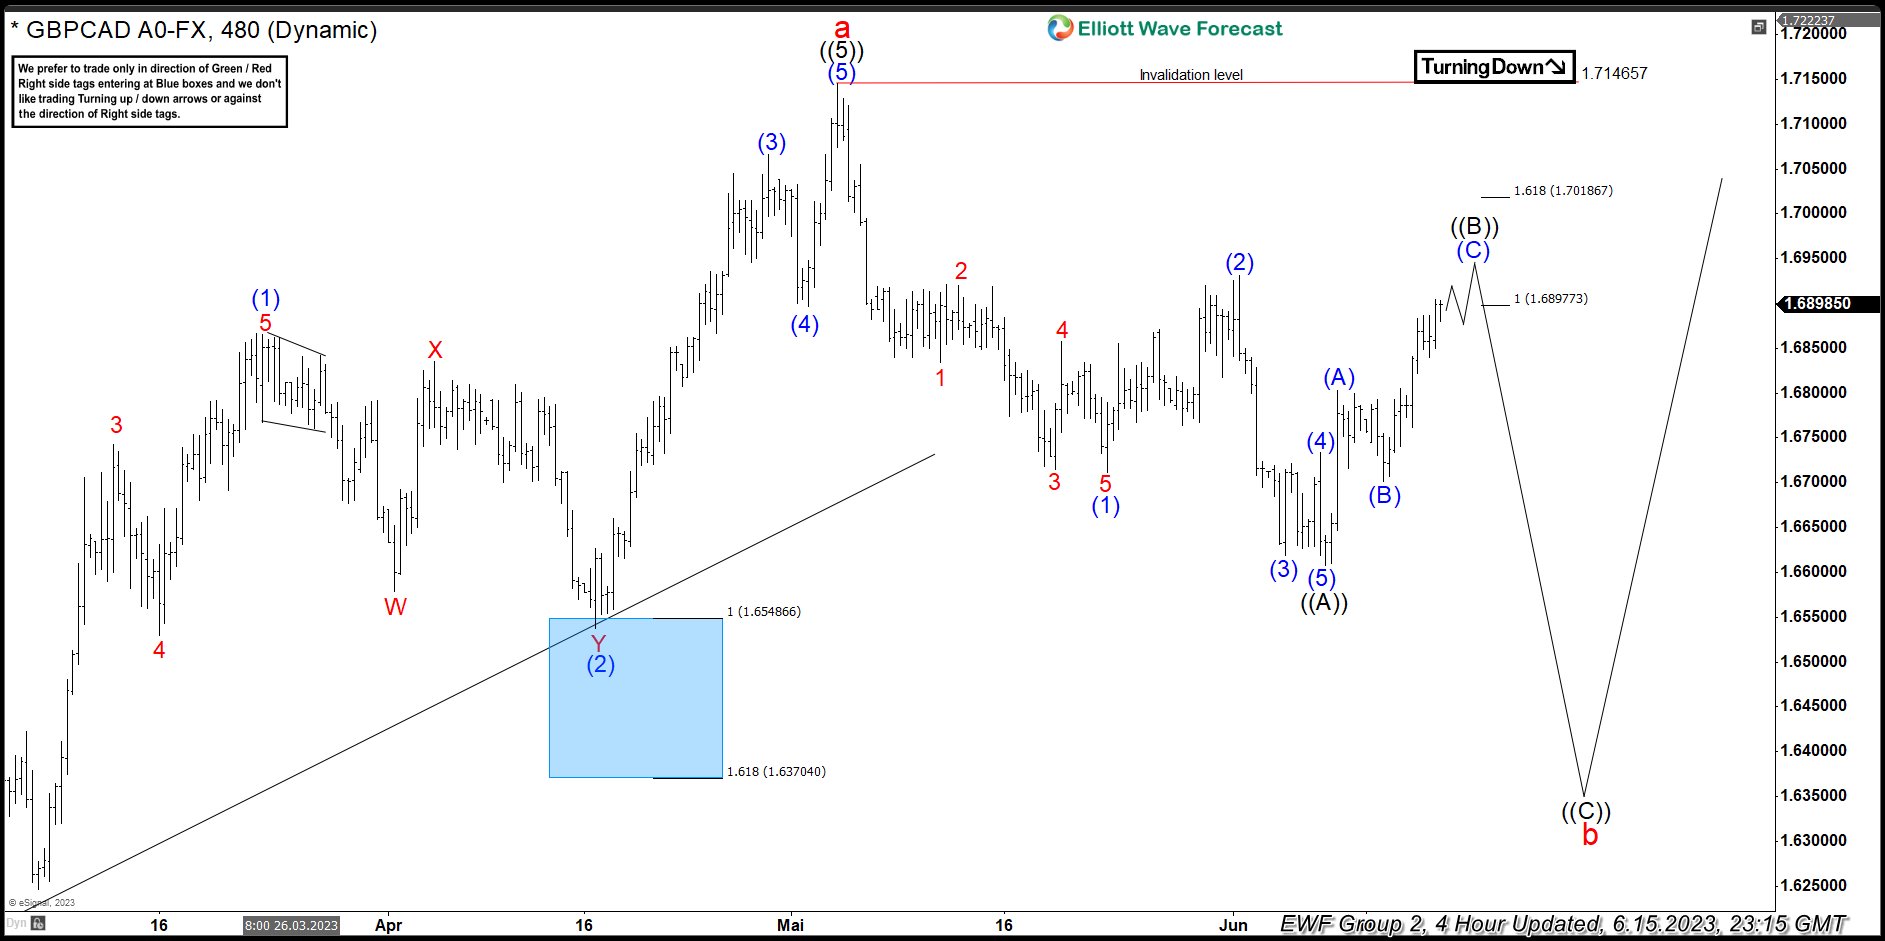
Here’s 4hr Elliott wave Chart from the 6/15/2023 update. In which, the decline to 1.6607 low ended a diagonal from the 3 May 2023 high in wave ((A)) & made a bounce in wave ((B)). The internals of that bounce unfolded as an Elliott wave zigzag correction where wave (A) ended at 1.6802 high. Then a pullback to 1.6701 ended wave (B) and started the (C) leg higher towards 1.6897- 1.7018 equal legs area from where sellers were expected to appear looking for more downside or for a 3 wave reaction lower at least.
GBPCAD Latest Elliott Wave Chart From 6.21.2023
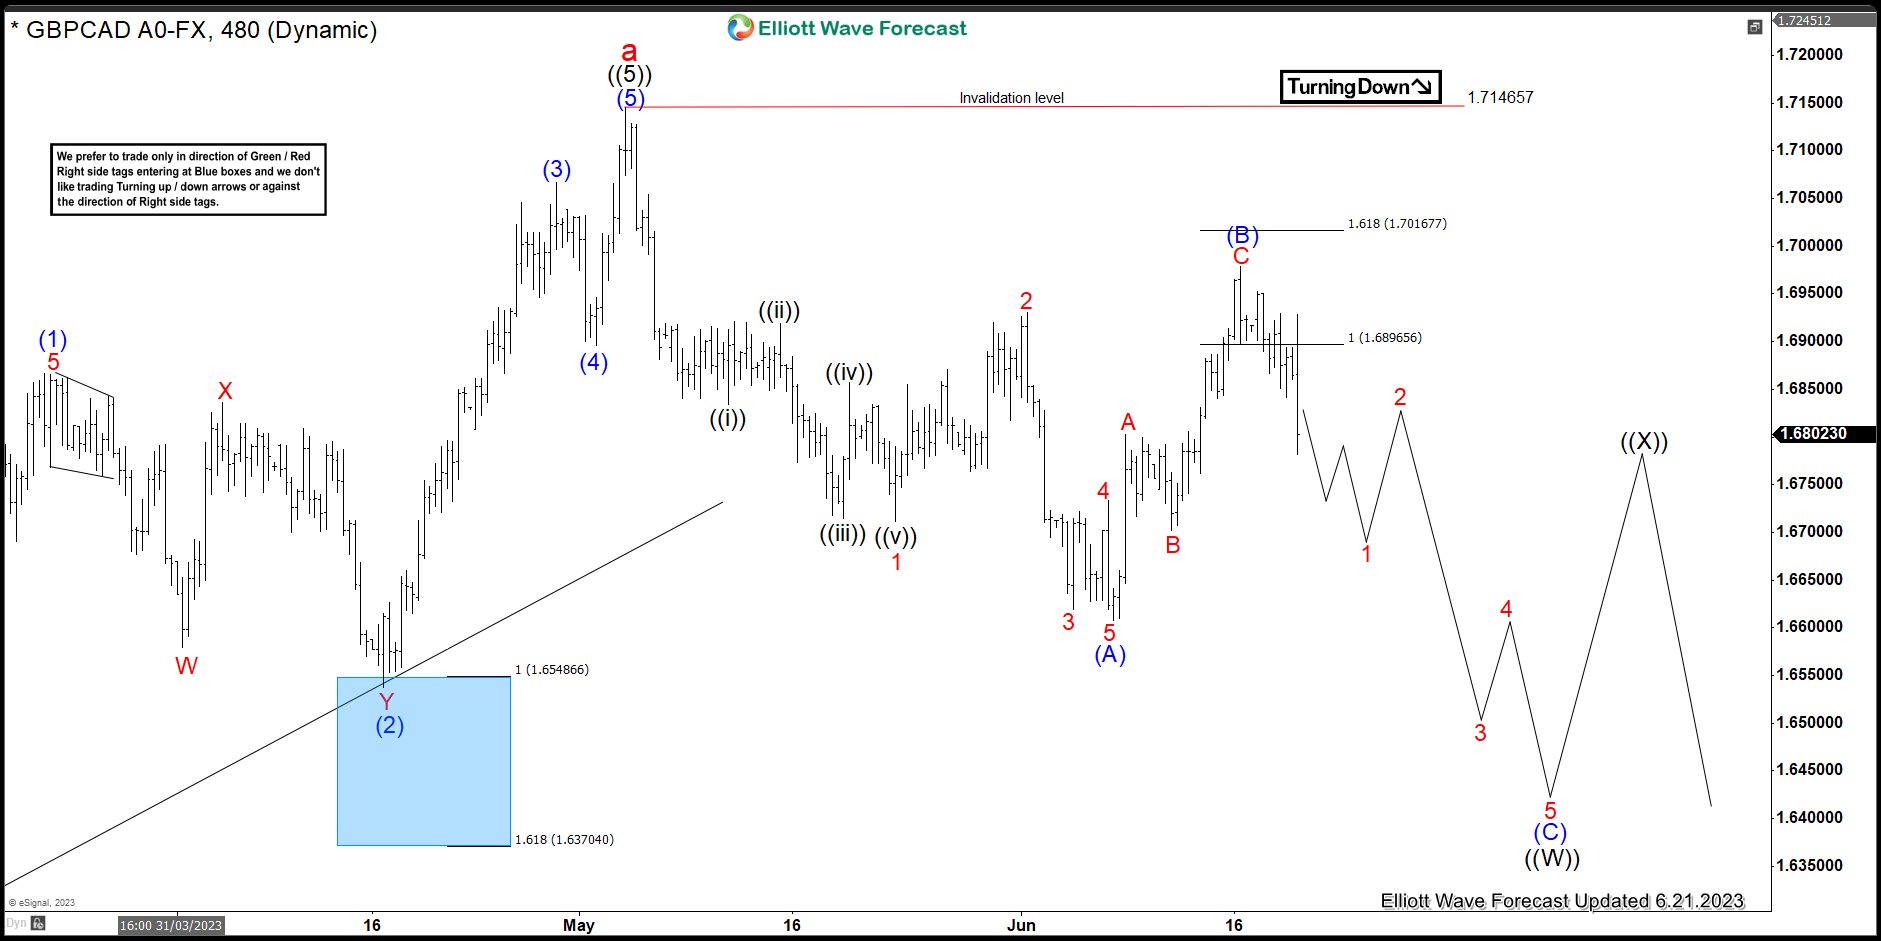
This is the Latest 4hr view from the 6/21/2023 update. In which the GBPCAD is showing a strong reaction lower taking place from the equal legs area allowing shorts to get into a risk-free position shortly after taking the position. However, the pair still needs to see a break below 1.6607 low to confirm the next extension lower towards 1.6440- 1.6314 area lower next.
Source: https://elliottwave-forecast.com/forex/gbpcad-reacting-perfectly-equal-legs/