
Hello Traders, in this article we will go through how USDSGD reacted lower after reaching an equal legs area. Here at Elliott Wave Forecast we have in place a system that allows us to measure an area in which we can expect a react to take place. We call it equal legs area or blue box area as you might have seen within our charts.
These areas provide us with at least an 85% chance of a minimum of 3 waves bounce or reaction to take place. Consequently, we can use these areas to enter in the market with a defined entry, Stop Loss and exit strategy.
The pair has been trading within a larger degree cycle since 03.10.2023. In the near term cycle it has ended wave ((iii)) of 1 on 06.13.2023 and a 3 waves bounce was then expected. Once we had establish the first leg in (a) and then connector (b) we presented to our members the equal legs area of (c) of ((iv)). Let’s have a look on how we saw it during our New York update on 06.15.2023.
USDSGD 1 Hour New York update 06.15.2023
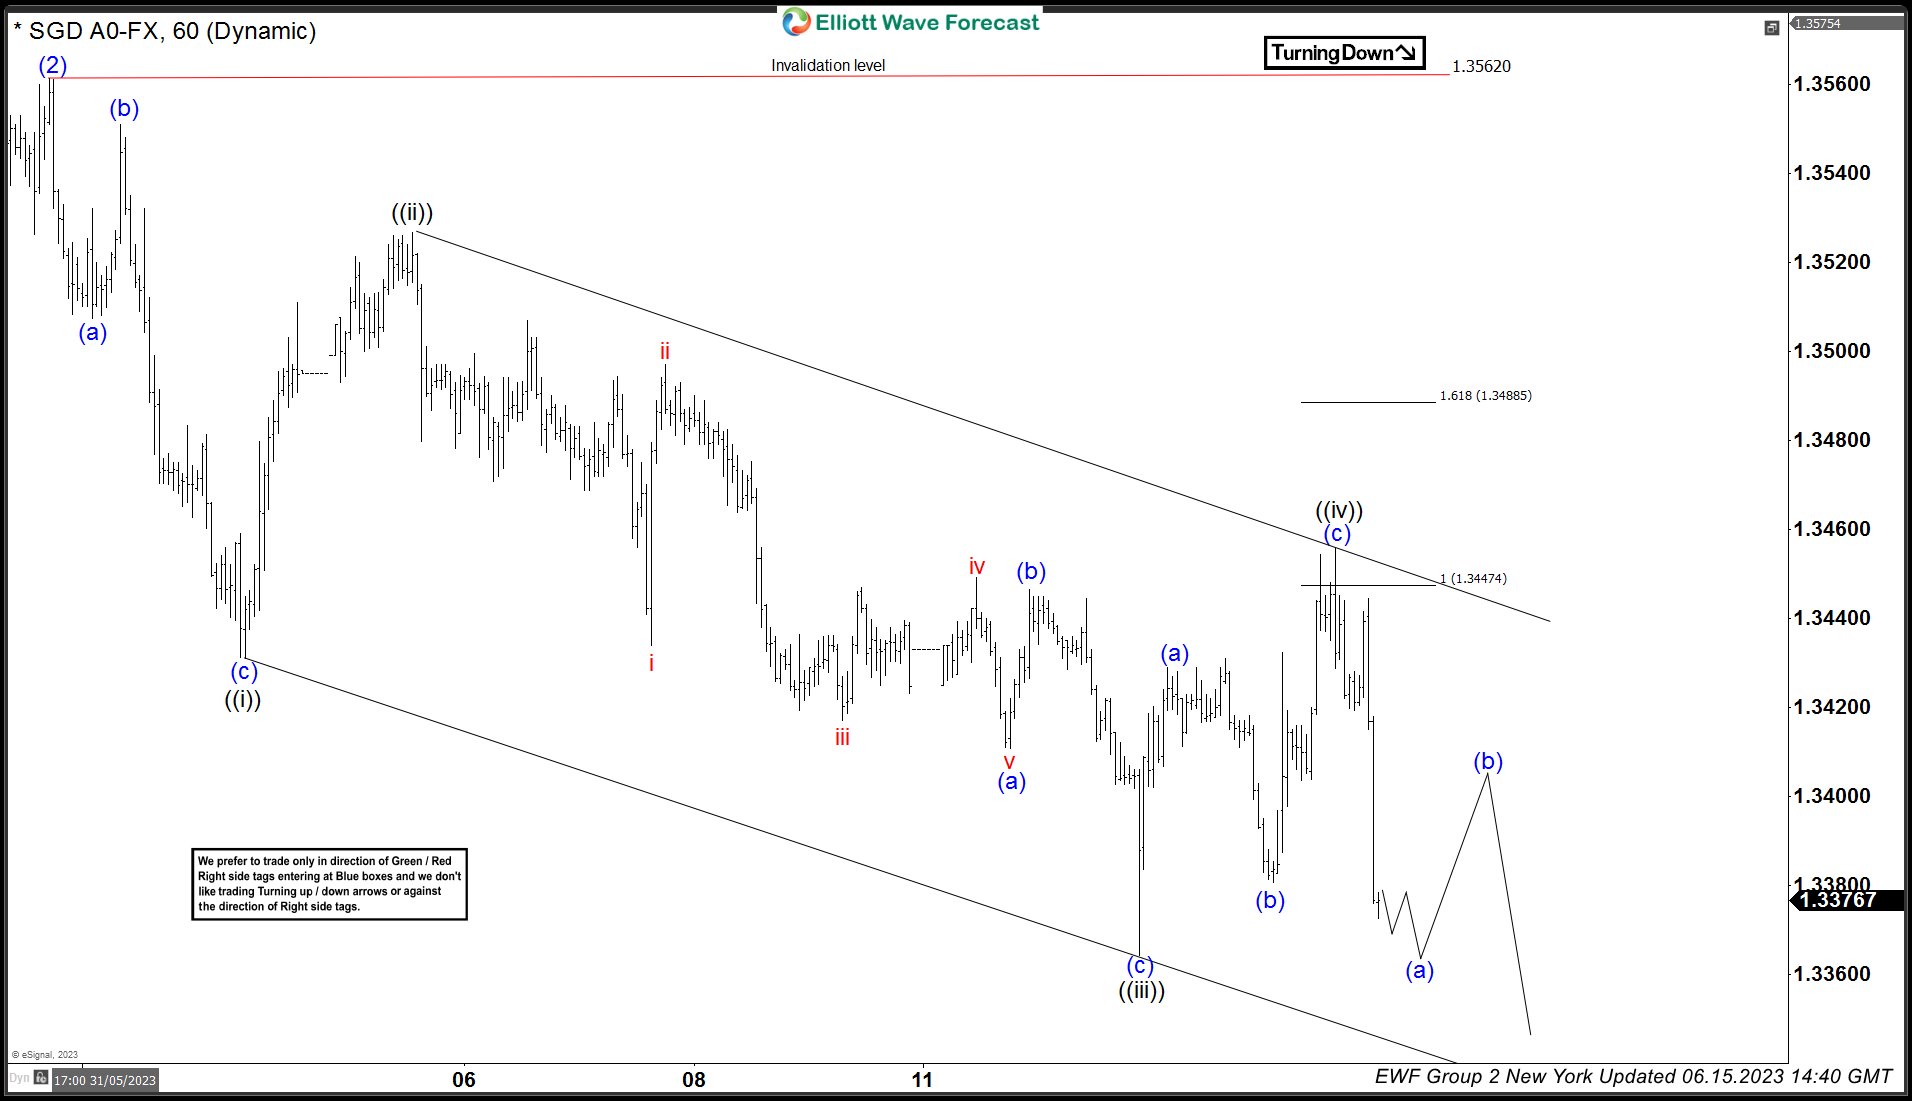
As we can see wave (c) of ((iv)) reached the equal legs area of 1.34474 – 1.34885 and started to react lower as expected. Reaction lower within (a) of ((v)) as a 3 swing structure.
Now let’s see the latest Weekend update and what we expect to happen next.
USDSGD 1 Hour Weekend update 06.18.2023
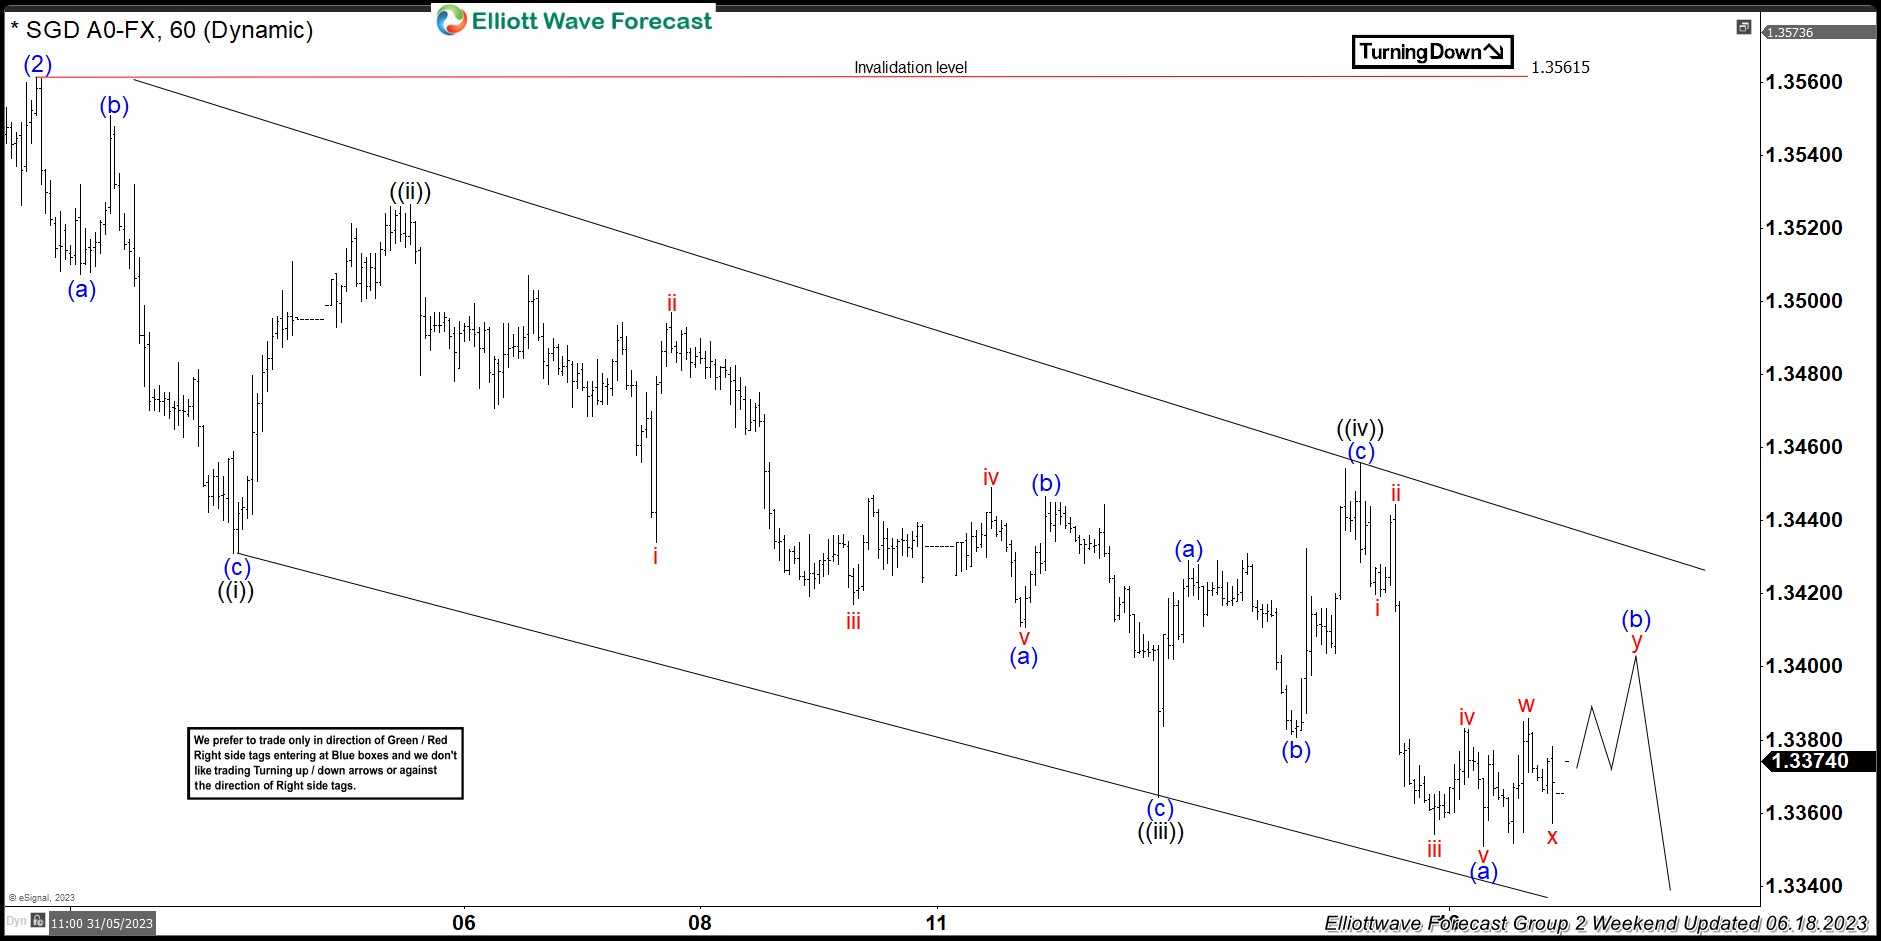
The pair has ended 5 waves to end (a) and now expecting bounce within y of (b) before the next leg lower. Should end (c) of ((v)) before ending a larger degree wave 1 of (3). You can learn how to trade equal legs, blue boxes and what is the target area for the last leg lower by becoming a member.
Source: https://elliottwave-forecast.com/forex/usdsgd-wave-iv-found-sellers-at-equal-legs-area/