
Hello fellow traders. In this article we’re going to take a quick look at the Elliott Wave charts of E-Mini S&P 500 ( ES_F) published in members area of the website. ES_F is showing impulsive bullish sequences in the short term cycles. Recently we got a 3 waves pull back that has ended right at the Blue Box zone. In the further text we are going to explain the Elliott Wave Forecast.
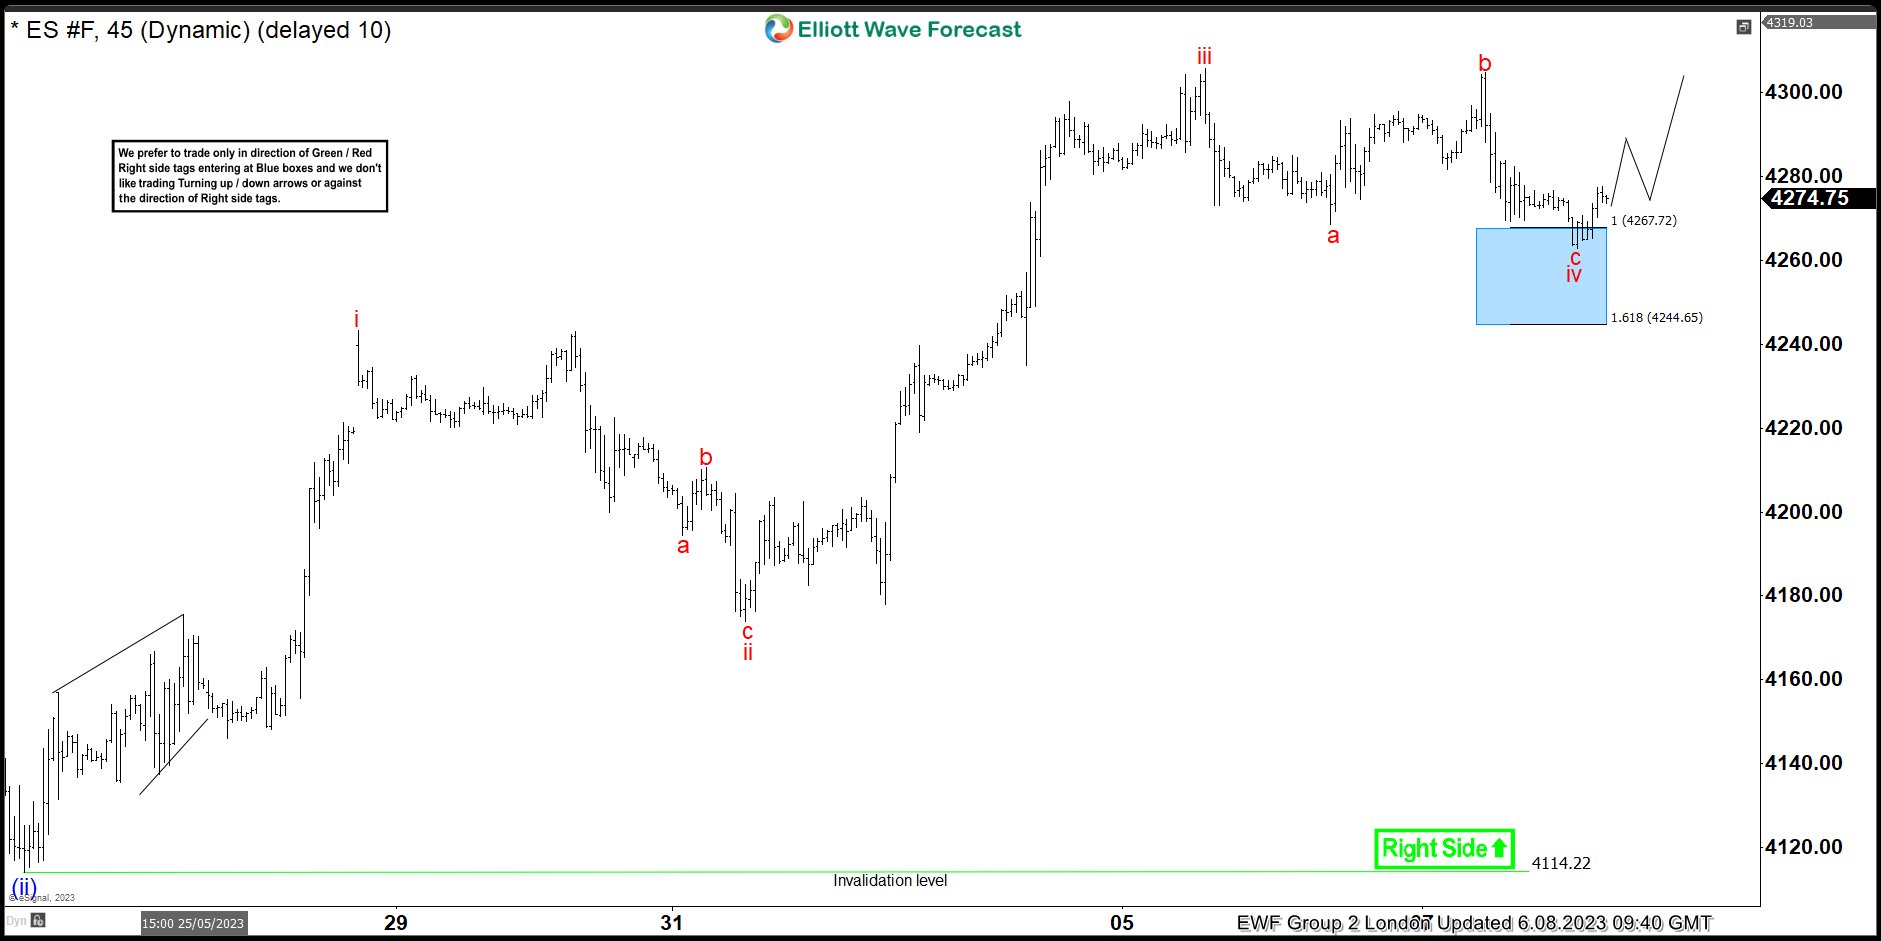
ES_F Elliott Wave 1 Hour Chart 06.08.2022
Rally from the 4114.2 low is unfolding as impulsive bullish structure which is still calling for further upside. We got short term pull back in 3 waves that has reached extreme area 4267.7-4244.6 , blue box ( buying zone) . As our members know Blue boxes are based on 100% – 161.8% Fibonacci extension area , that we trade in 3, 7, or 11 swing corrective sequence.
We already got some shallow reaction from the blue box. So, pull back could be already done. However we need to see further separation from the lows to get confirmation. Members who are long from the blue box should make position risk free once bounce reaches 50 Fibs against the b red high. We will put SL at BE and at the same time take partial profits from the trades. In case the price extends lower before bounce happens, and breaks 1.618 fib ext : 4244.6 , that would invalidate the trade.
Official trading strategy on How to trade 3, 7, or 11 swing and equal leg is explained in details in Educational Video, available for members viewing inside the membership area.
Quick reminder on how to trade our charts :
Red bearish stamp+ blue box = Selling Setup
Green bullish stamp+ blue box = Buying Setup
Charts with Black stamps are not tradable. 🚫
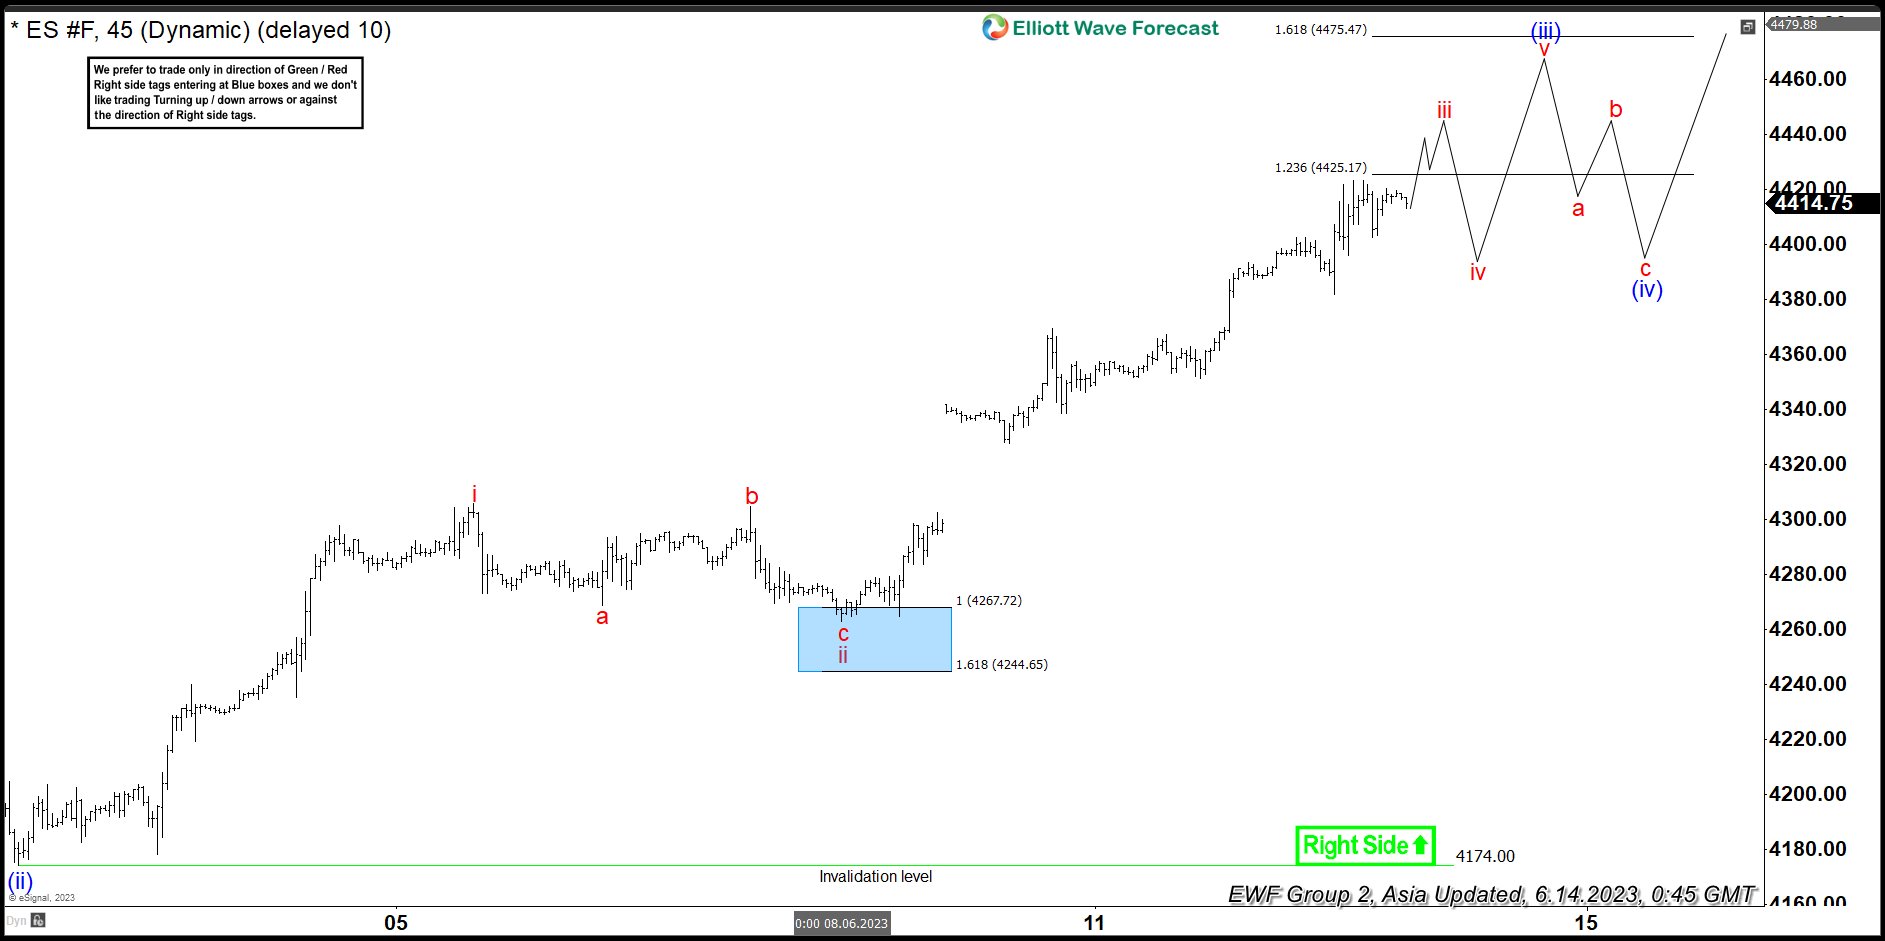
ES_F Elliott Wave 1 Hour Chart 06.08.2022
ES_F made very good rally from our buying zone. The futures has eventually broken toward new highs, confirming further extension up. Currently ES_F is approaching 4425.17-4475.4 area, where buyers could be taking profits. From that zone we can see some short term pull backs. We don’t recommend selling it in any proposed pull back against the main trend which is still bullish at the moment.
Keep in mind that market is dynamic and presented view could have changed in the mean time. You can check most recent charts in the membership area of the site. Best instruments to trade are those having incomplete bullish or bearish swings sequences. We put them in Sequence Report and best among them are shown in the Live Trading Room
Source: https://elliottwave-forecast.com/trading/sp-500-e-mini-futures-es_f-lue-box/