
Good Day Traders. In today’s article, we will look at the past performance of the 1 Hour Elliott Wave chart of Apple, Inc. ($AAPL) The rally from 5.03.2023 low unfolded as a 5 wave impulse and ended on 5.19.2023 at $176.43. A 7 swing corrective pullback (WXY) took place since that peak. So, we advised members to buy the pullback in 7 swings at the blue box area ($171.31 – 168.93). We will explain the structure & forecast below:
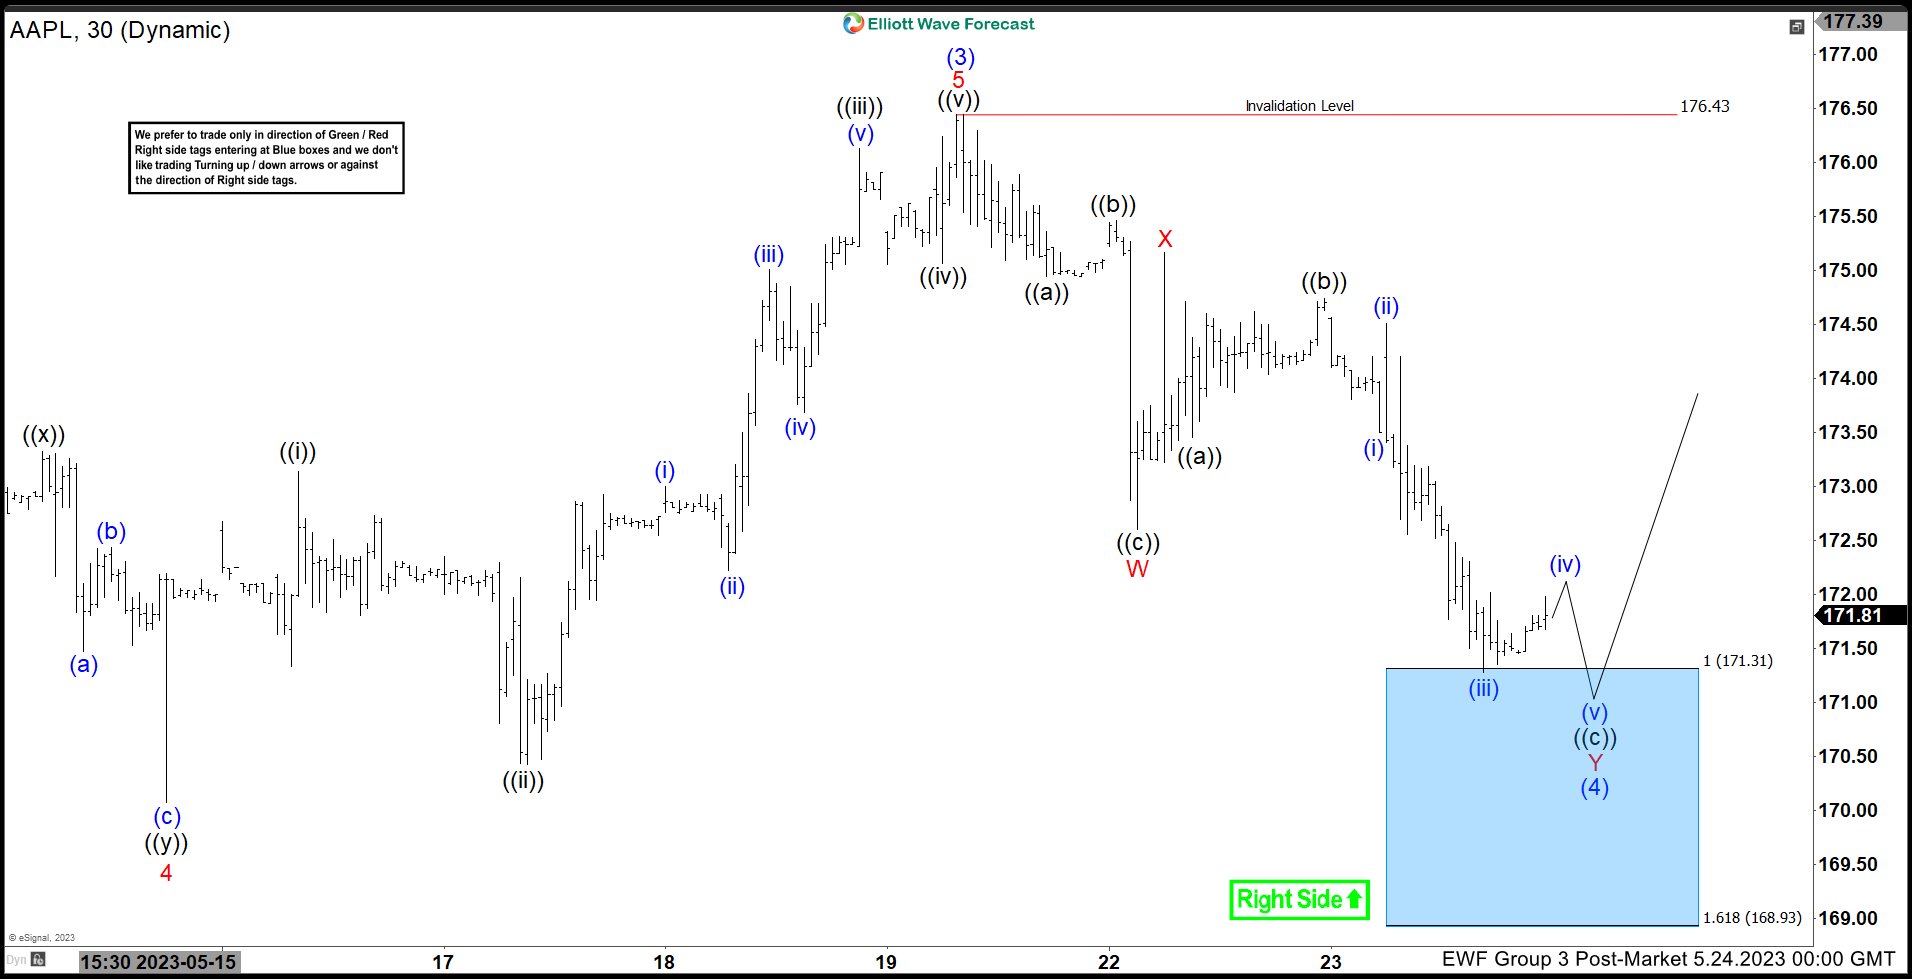
$AAPL 1H Elliott Wave Chart 5.24.2023:
Here is the 1H Elliott Wave count from 5.24.2023. The rally from 5.03.2023 unfolded in a 5 wave impulse which signaled a bullish trend. We were calling for the pullback to find buyers in 7 swings at $171.31 – 168.93 where we like to enter as buyers.
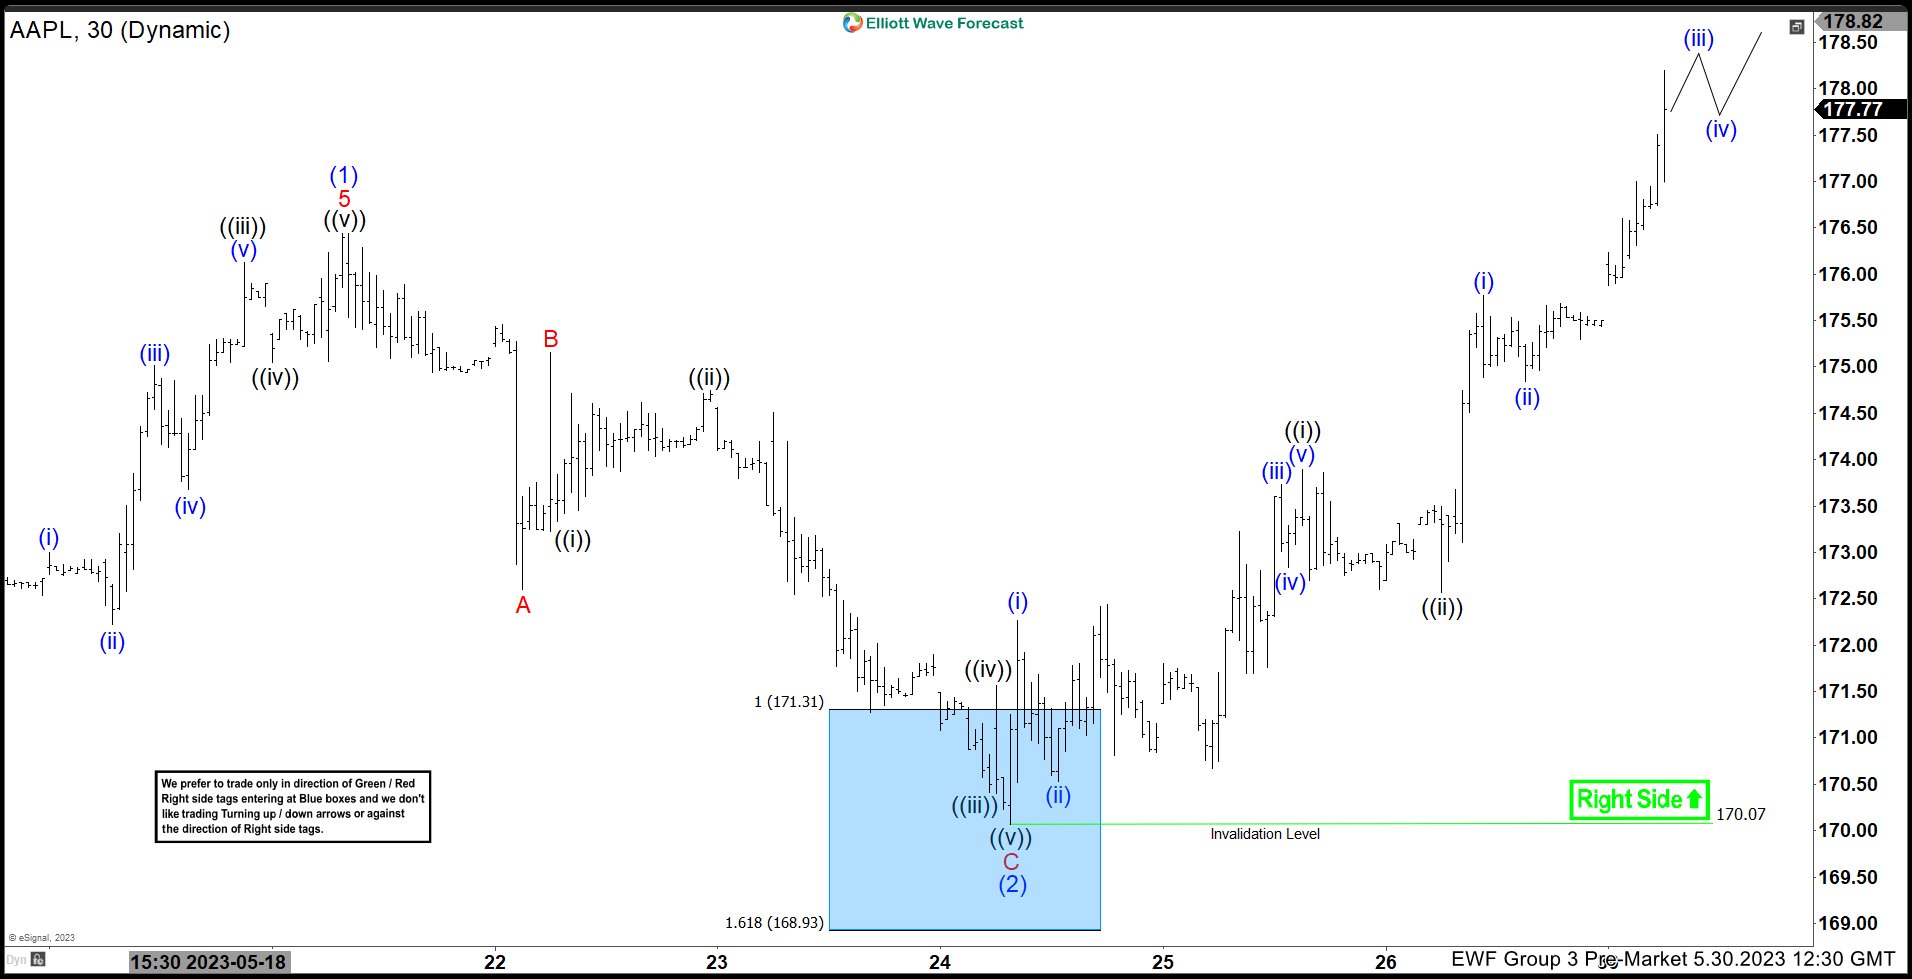
$AAPL 1H Elliott Wave Chart Latest View:
Here is the latest 1H update showing the move taking place as expected. The stock has reacted higher ending the cycle from 5.19.2023 peak and eventually breaking above it which confirms more upside is to be seen. We remain long with a risk free position targeting new all time highs and won’t be surprised to see $AAPL trading towards $270 area in the long term.
Source: https://elliottwave-forecast.com/uncategorized/apple-inc-aapl-reacts-higher-blue-box-area/