
XPeng, Inc. (XPEV) designs, develops, manufactures, and markets smart electric vehicles. It produces environmental friendly vehicles, namely SUVs (the G3), and a four-door sports sedan (the P7). The company was founded by Xiao Peng He, Heng Xia, and Tao He in 2015 and is headquartered in Guangzhou, China. We published an article on XPEV back in March 2023 in which we looked at the Elliott wave structure of the decline since November 2020 peak and determine whether selling pressure is likely to continue for a prolonger period or it would end soon resulting in buyers entering the market. Today, we will look at the updated charts and present two possible views. Despite two possibilities in the mid-term, we still see another leg lower as a higher probability and view it as a buying opportunity.
XPEV Elliott Wave Analysis – Weekly Time Frame – May 22, 2023
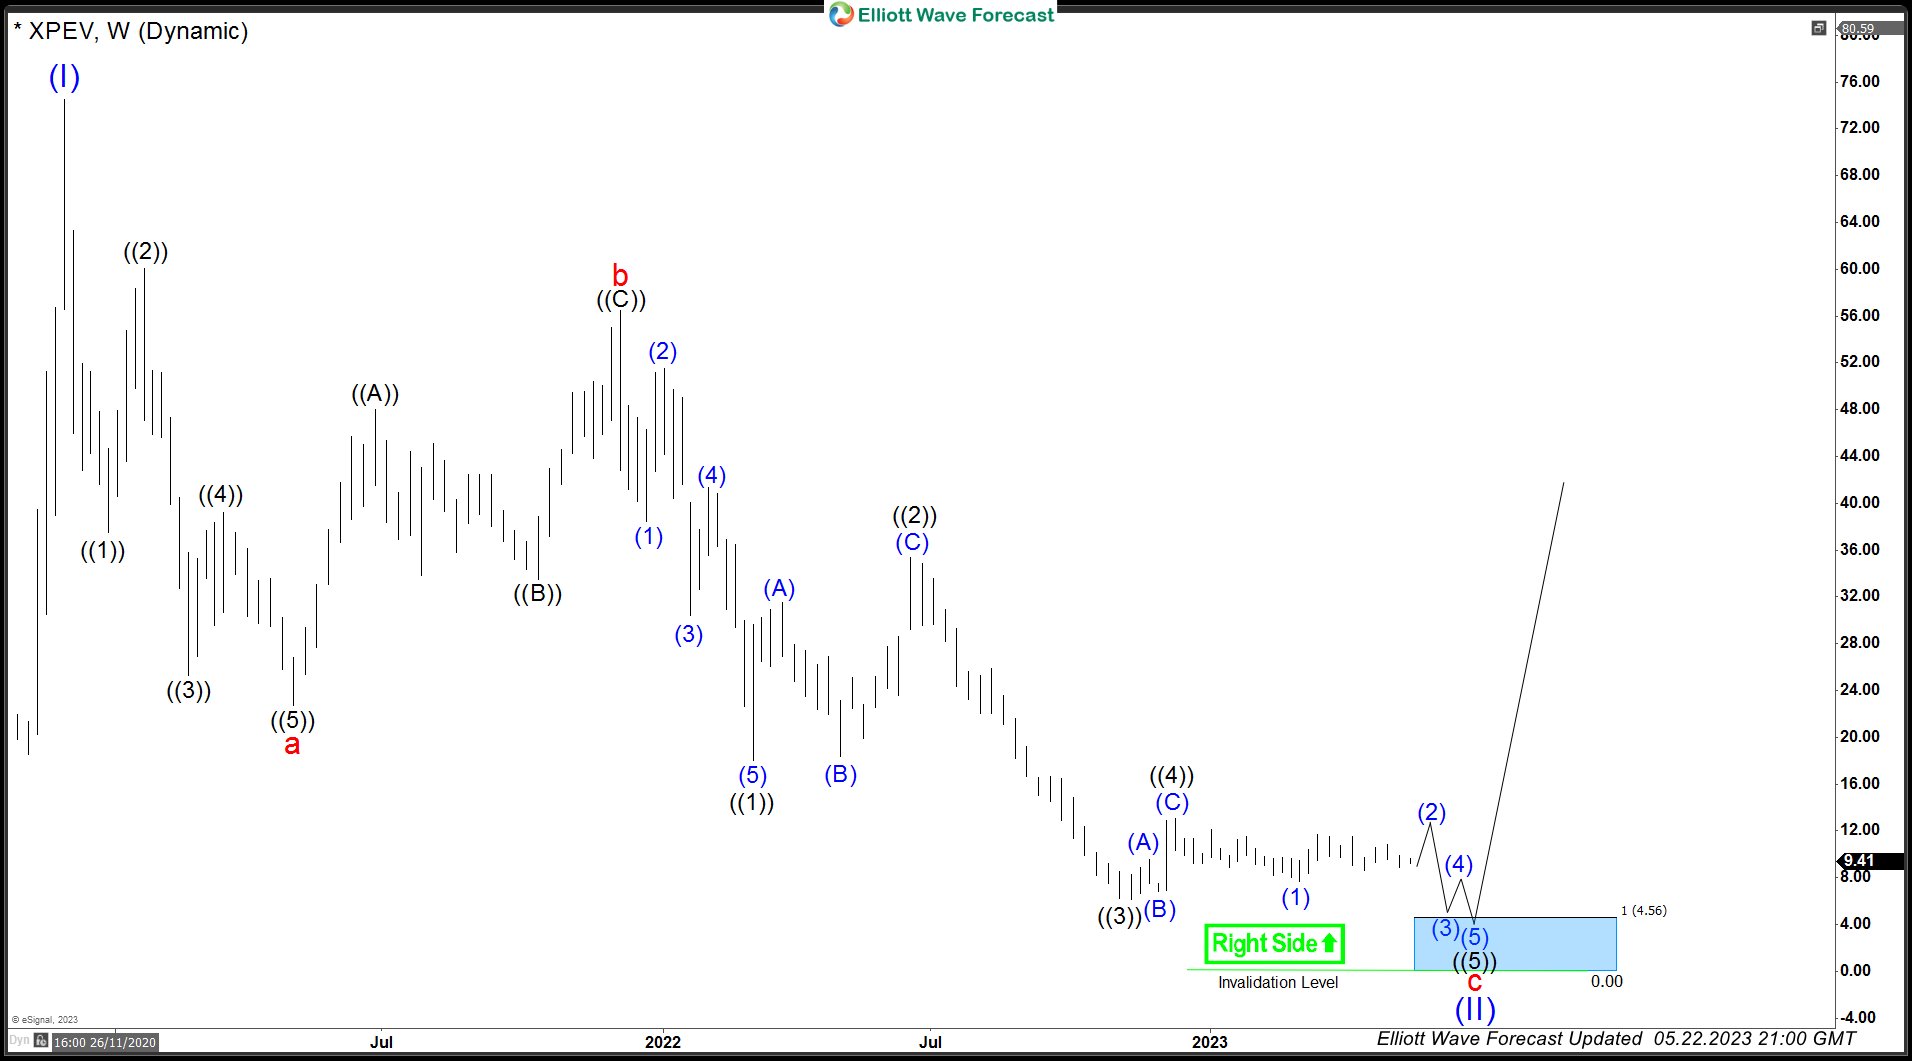
As we mentioned in the previous article, decline from November 2020 is taking the form of a Zigzag Elliott wave structure. We can see first leg of the decline i.e. wave “a” is from $74.49 to $22.73. This was followed by a 3 waves bounce to $56.45 which completed wave “b”. Internal structure of wave “b” was another zigzag structure. Then the decline resumed and we have already seen a new low below $22.73 confirming wave “c” lower is in progress. Within wave “c”, wave ((1)) completed at $18.01, wave ((2)) completed at $35.35 and wave ((3)) completed at $6.25. This was followed by a bounce to $13.10 and stocks has started turning lower again. It has not yet made a new low below $6.25 but we are calling wave ((4)) completed at $13.10 and wave (1) of ((5)) completed at $8.03 and wave (2) of ((5)) is expected to bounce but fail below $13.10 for continuation lower in wave (3) of ((5)) which should be followed by a bounce in wave (4) and another leg lower to complete wave ((5)) and wave “c” of the zigzag Elliott wave structure around $4.48 or lower levels. This area should see buyers entering for a long-term swing and resume the larger rally or produce 3 waves reaction higher at least.
XPEV Elliott Wave Analysis – Double in wave ((4)) Scenario – May 22, 2023
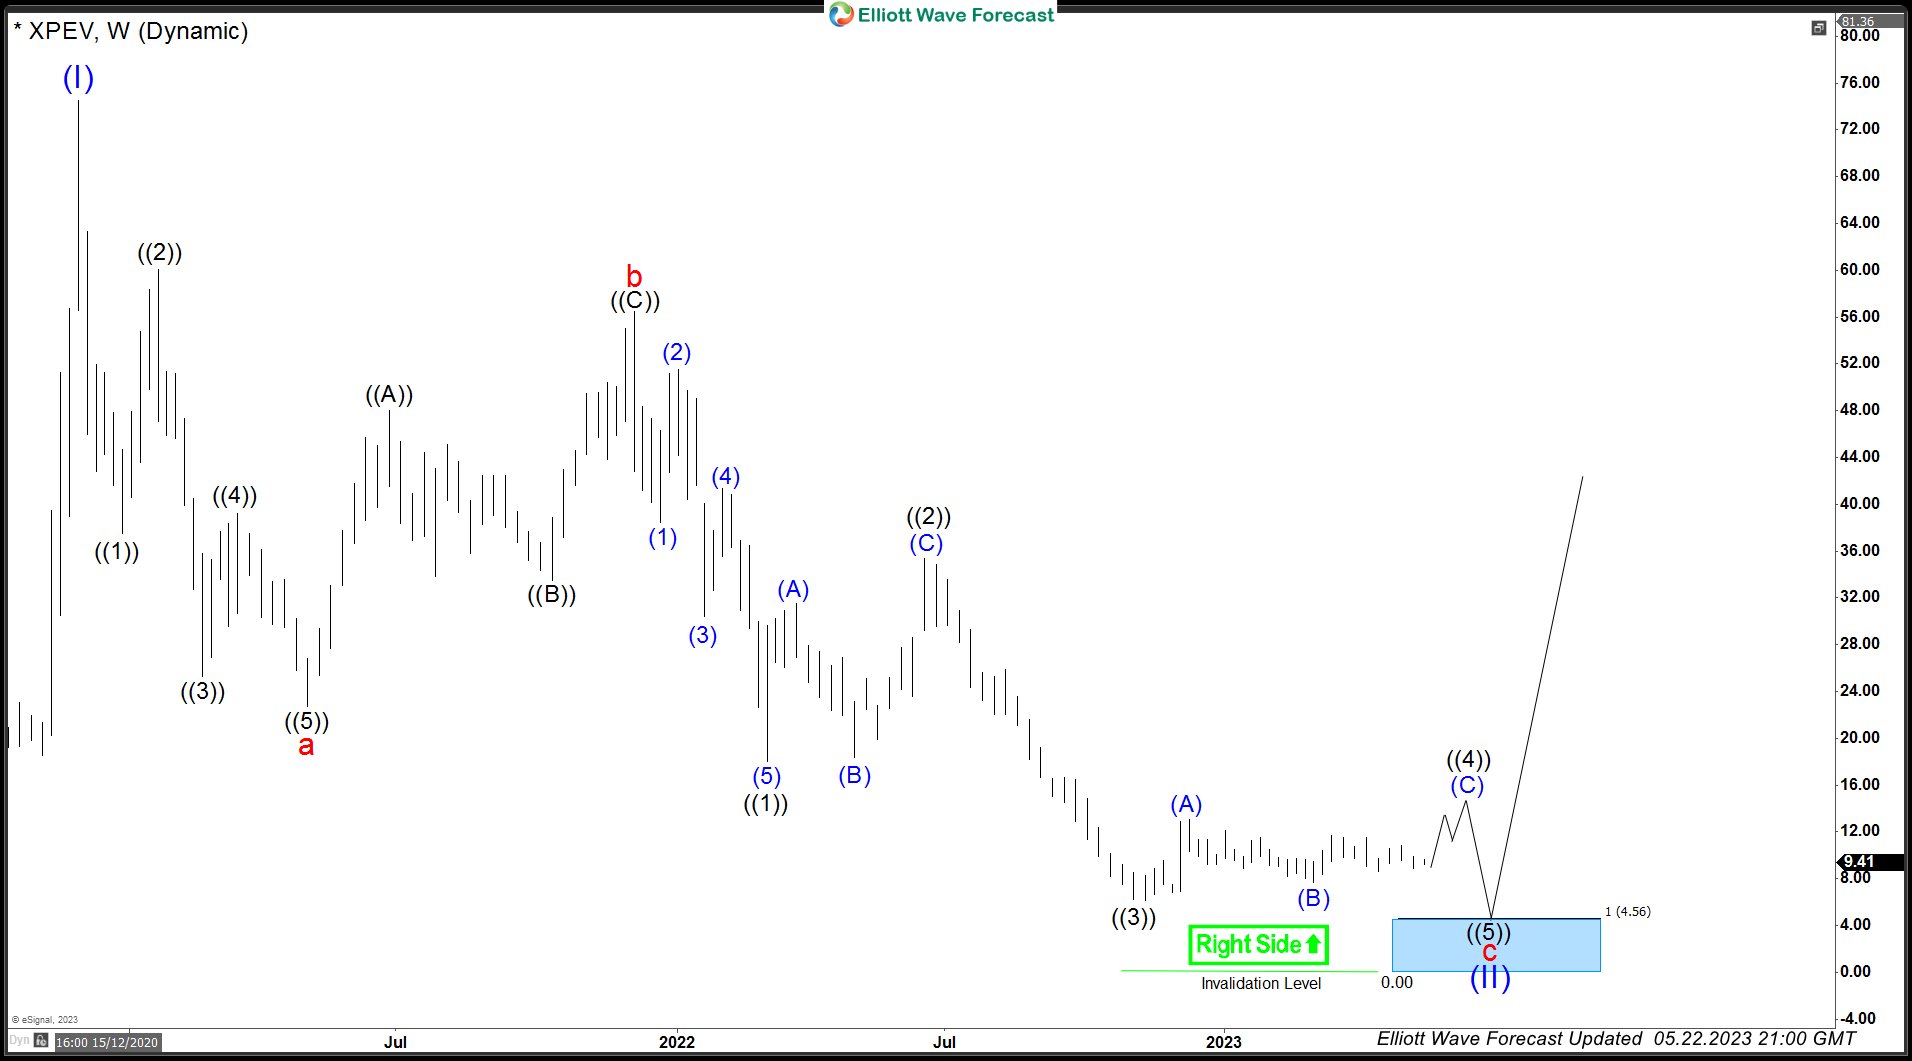
In case of a break above $13.10, we should still be in wave ((4)) as a double correction towards $14.69 – $19.02 after which we would still expect another lower in wave ((5)) toward $4.48 or lower levels to complete wave “c” from November 2021 peak with one more leg lower still to come to complete zigzag Elliott Wave Structure down from November 2020 peak.
Source: https://elliottwave-forecast.com/stock-market/xpev-elliott-wave-view-may-update/