
Hello fellow traders. In this article we’re going to take a quick look at the Elliott Wave charts of S&P 500 ( SPX) published in members area of the website. As our members know SPX is showing incomplete structure in the cycle from the January 2022 peak, calling for potential extension lower. Recently we got a 3 waves bounce that completed right at the extreme zone as we expected. In the further text we are going to explain the Elliott Wave Forecast.
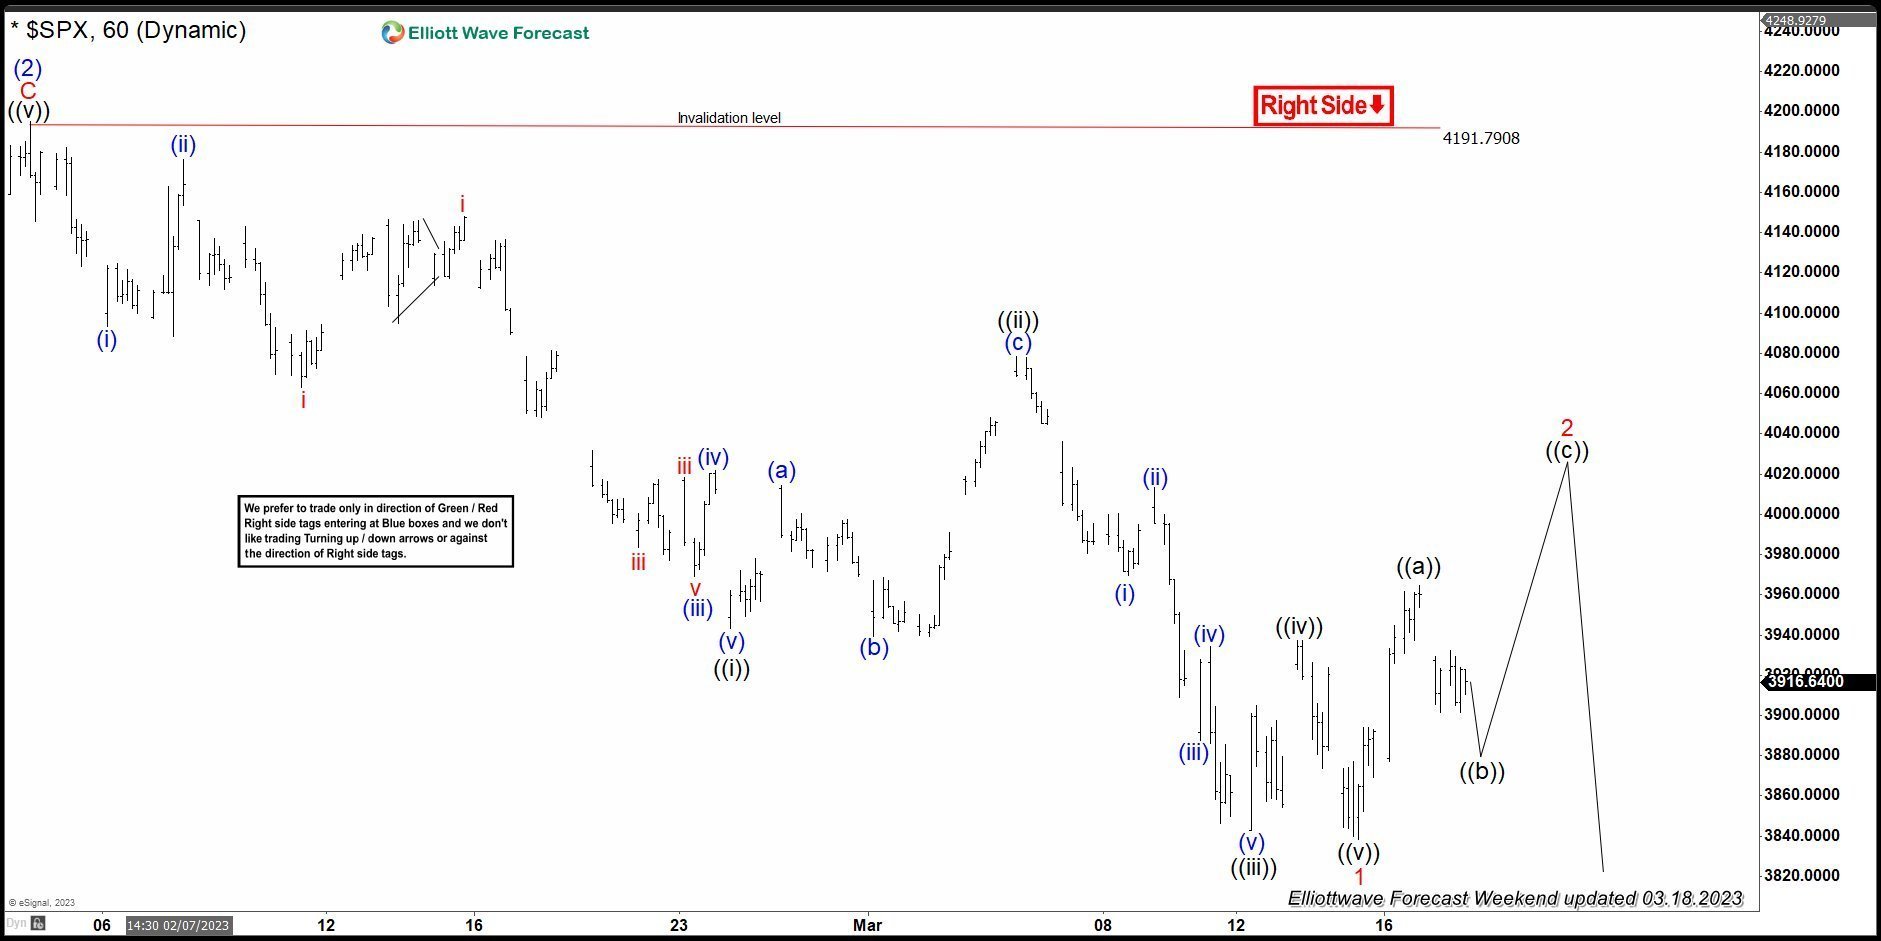
SPX Elliott Wave 1 Hour Chart 03.18.2023
We are calling cycle from the 4191.79 peak completed as 5 waves structure. Currently SPX is doing correction against the mentioned high. For now we can count only 5 waves up from the low, which means recovery is potentially unfolding as Elliott Wave Zig Zag Pattern . We expect to see another push up, before further decline continues. We would like to see break above previous short term high ((a)) black to confirm proposed view.
You can learn more about Elliott Wave Patterns at our Free Elliott Wave Educational Web Page.
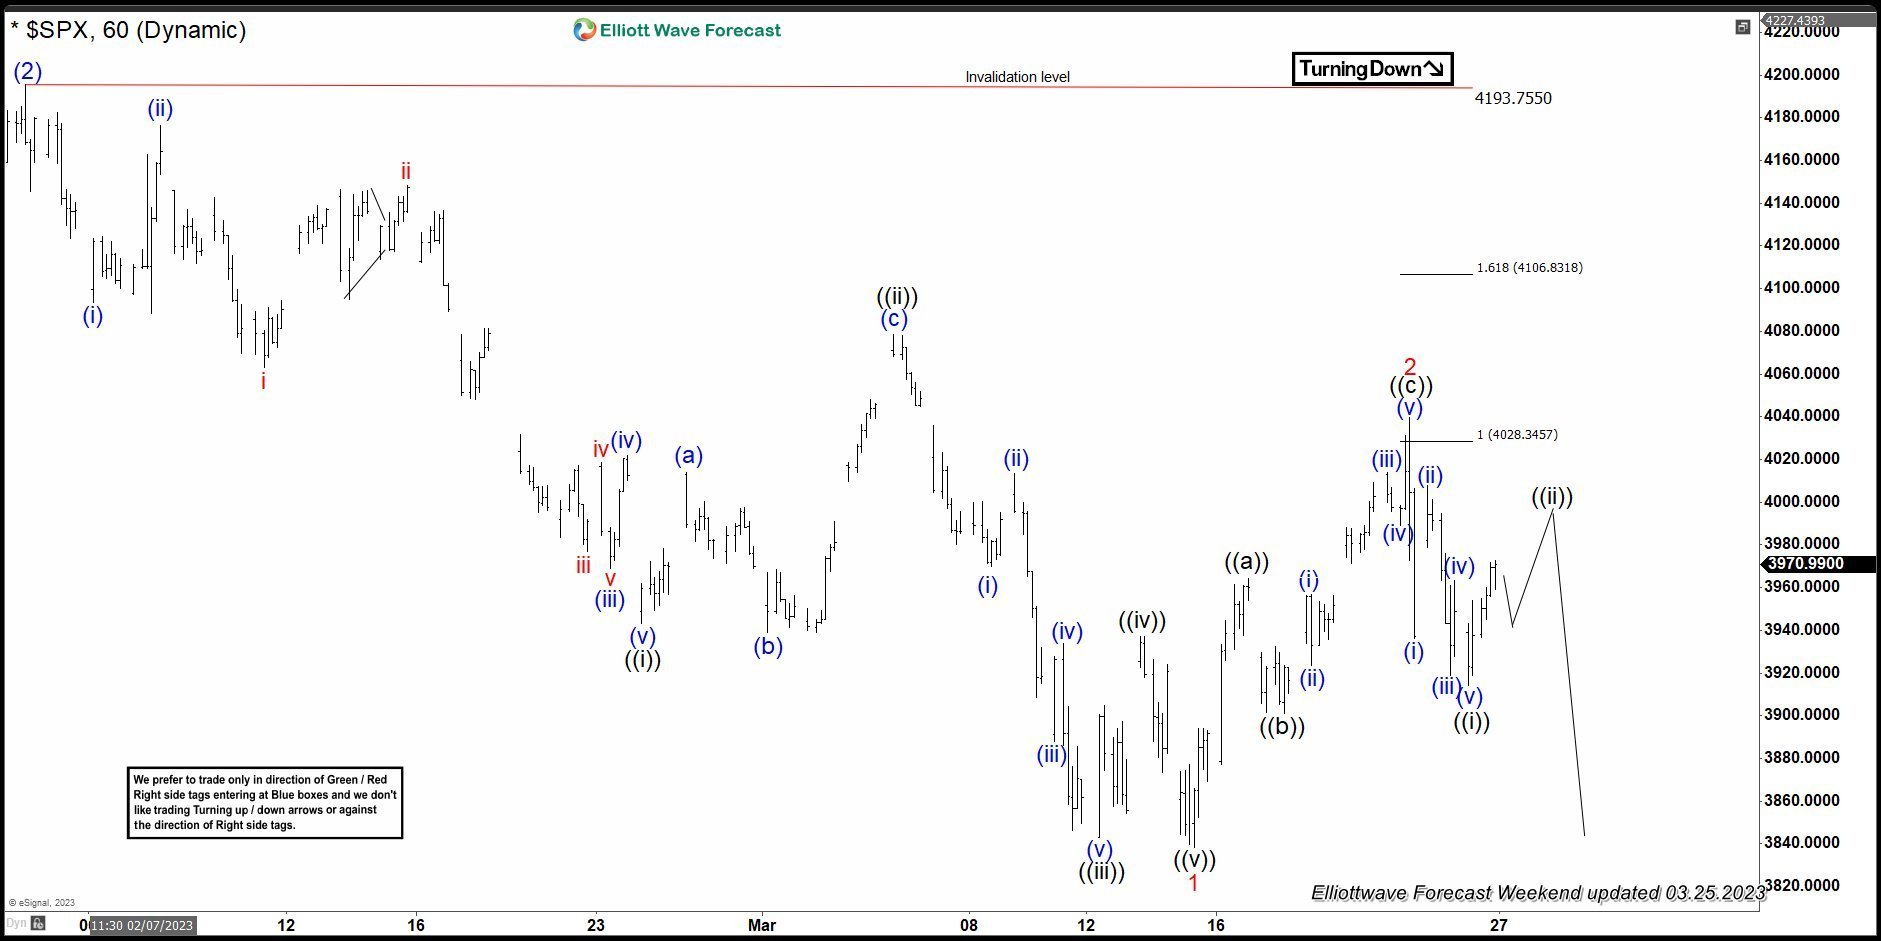
SPX Elliott Wave 1 Hour Chart 03.22.2023
The index break above previous peak ((a)) black and continued trading higher as expected. Now, when we have a connector ((b)) low, we are able to measure potential target for 3 waves recovery. We expect correction to complete at 4028.34-4106.83 area. At that zone we believe buyers will be taking profits and sellers will appear. From there we expect to see either further decline toward new lows, or 3 waves pull back alternatively.

SPX Elliott Wave 1 Hour Chart 03.23.2023
SPX reached our target area 4028.34-4106.83 and found sellers as expected. We got very nice reaction from there. Current view suggests correction can be done at 4039.24 high. That is the key level for proposed short term count. As far as the price stays below that high, continuation lower is favored. Otherwise break above 4039.24 would mean, extension within the short term recovery against the 4193.75 high. In that case SPX could see more upside toward 4132.9+ area.
Keep in mind that market is dynamic and presented view could have changed in the mean time. You can check most recent charts in the membership area of the site. You will also get 24h support in the chat room, where you can ask questions about the markets and talk to our market experts anytime during the day. Best instruments to trade are those having incomplete bullish or bearish swings sequences. We put them in Sequence Report and best among them are presented in the Live Trading Room
Source: https://elliottwave-forecast.com/stock-market/sp500-spx-elliott-wave/