
As one of the most recognizable beverage companies globally, Coca-Cola (NYSE: KO) is a well-known name in the stock market. Over the last two months, the stock has been range-bound, prompting investors to question whether it will break out of its sideways pattern. The lack of directional momentum has led to uncertainty regarding the stock’s future price movement. In this article, we will examine the Elliott Wave technical analysis of the stock to provide insight into the likelihood of a breakout.
KO Elliott Wave 8 Hour Chart
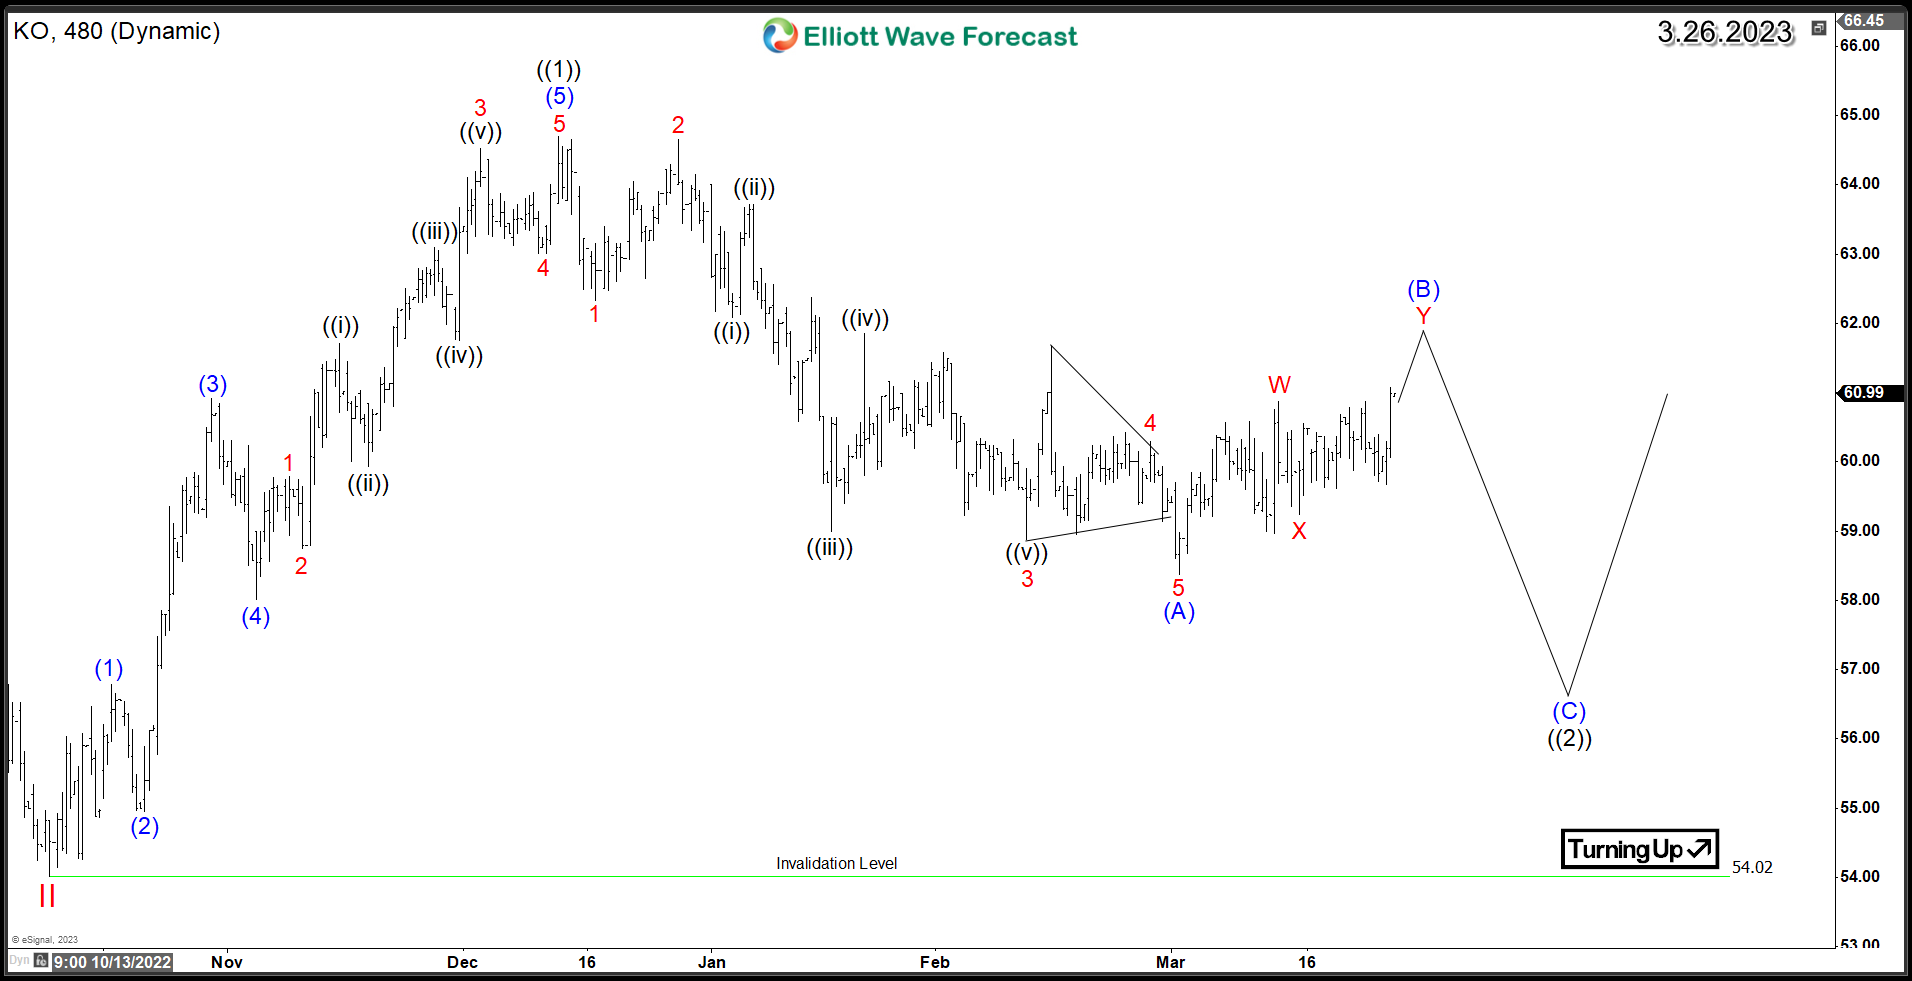
Starting from the October 2022 low of 54, Coca-Cola’s (KO) stock experienced an impulsive 5-wave advance that ended at 64.67, marking the completion of wave ((1)). Since then, the stock has begun a potential Zigzag corrective structure, with wave (A) ending at 58.38 earlier this month. Currently, the stock is in a bounce of wave (B), which is projected to fail below the December 2022 peak before initiating another downward movement in wave (C).
KO Elliott Wave 1H Chart
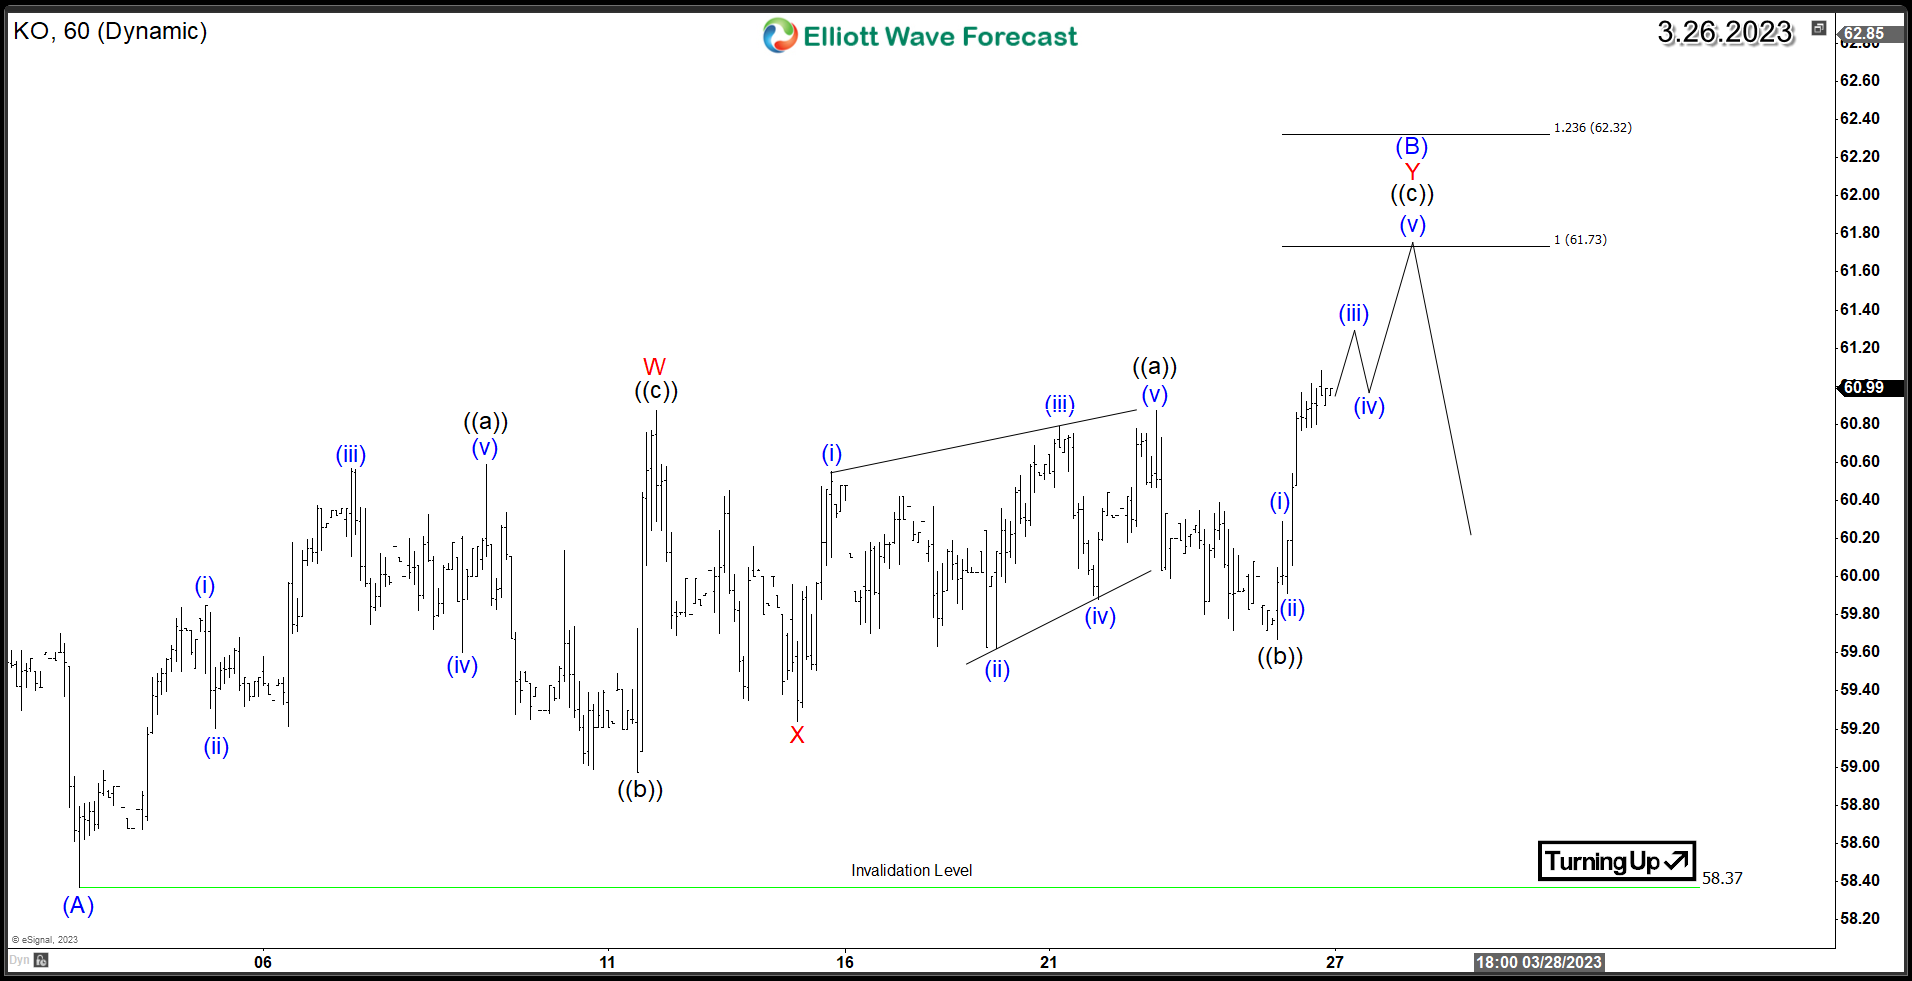
Wave (B) is unfolding as a double three structure, and it is currently showing an incomplete short-term bullish sequence. Last week, the stock made a new marginal high above wave W, indicating a potential bullish trend. The structure suggests that wave ((c)) of Y is still in progress and may reach the equal legs area of 61.73-62.32. This area is expected to create a reaction lower in at least 3 waves, after which the stock will have a chance to define the next 4-hour cycle.
As long as the stock holds above the October 2022 low and does not break below 58.37, the downside risk for Coca-Cola’s stock will likely remain limited. This provides some level of support for investors looking to make short-term investments in the company.
Source: https://elliottwave-forecast.com/stock-market/short-term-ceiling-cocacola-ko/