The Global X Lithium & Battery Tech ETF (LIT) invests in the full lithium cycle, from mining and refining the metal, through battery production. The Global X Lithium & Battery Tech ETF (LIT) seeks to provide investment results that correspond generally to the price and yield performance, before fees and expenses, of the Solactive Global Lithium Index.
LIT WEEKLY CHART OCTOBER 2022
Lithium ETF (LIT) ended a bullish cycle in November 2021, and we call it wave (I). Wave I ended at 41.19 and we had a 3 waves correction to end wave II at 17.82. Then in March 2020, we saw a strong bounce toward 74.95 to complete wave III and a pullback as wave IV ending at 55.00. The latest rally made new 5 waves to finish at 97.26 and complete wave V and wave (I).
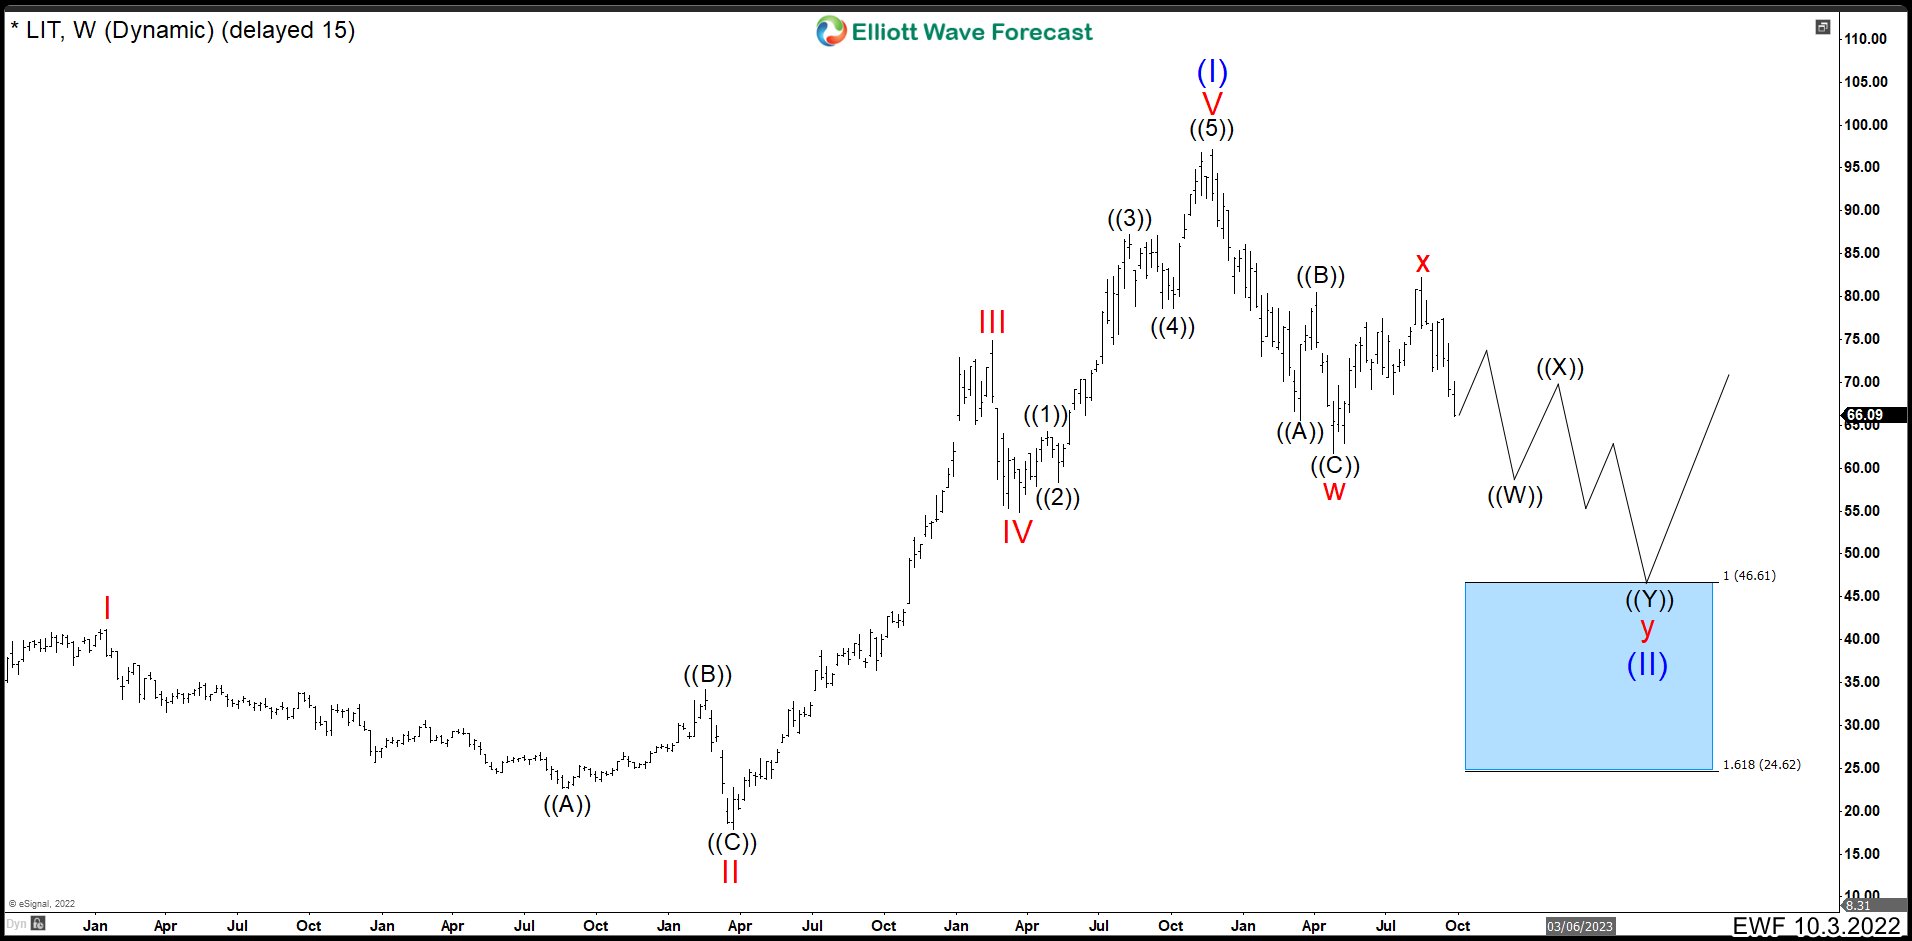
From this point the downward movement started, and it seems that it should complete a double correction before continuing with a rally. We can clearly see 3 swings down to complete wave w at 61.50. Then the x-connector ended at 82.15 and continue lower. Finishing the wave x, we called LIT could build a double correction structure as we can see in the chart. It should reach the 46.61 – 24.62 area and continue a rally.
LIT WEEKLY CHART MARCH 2023
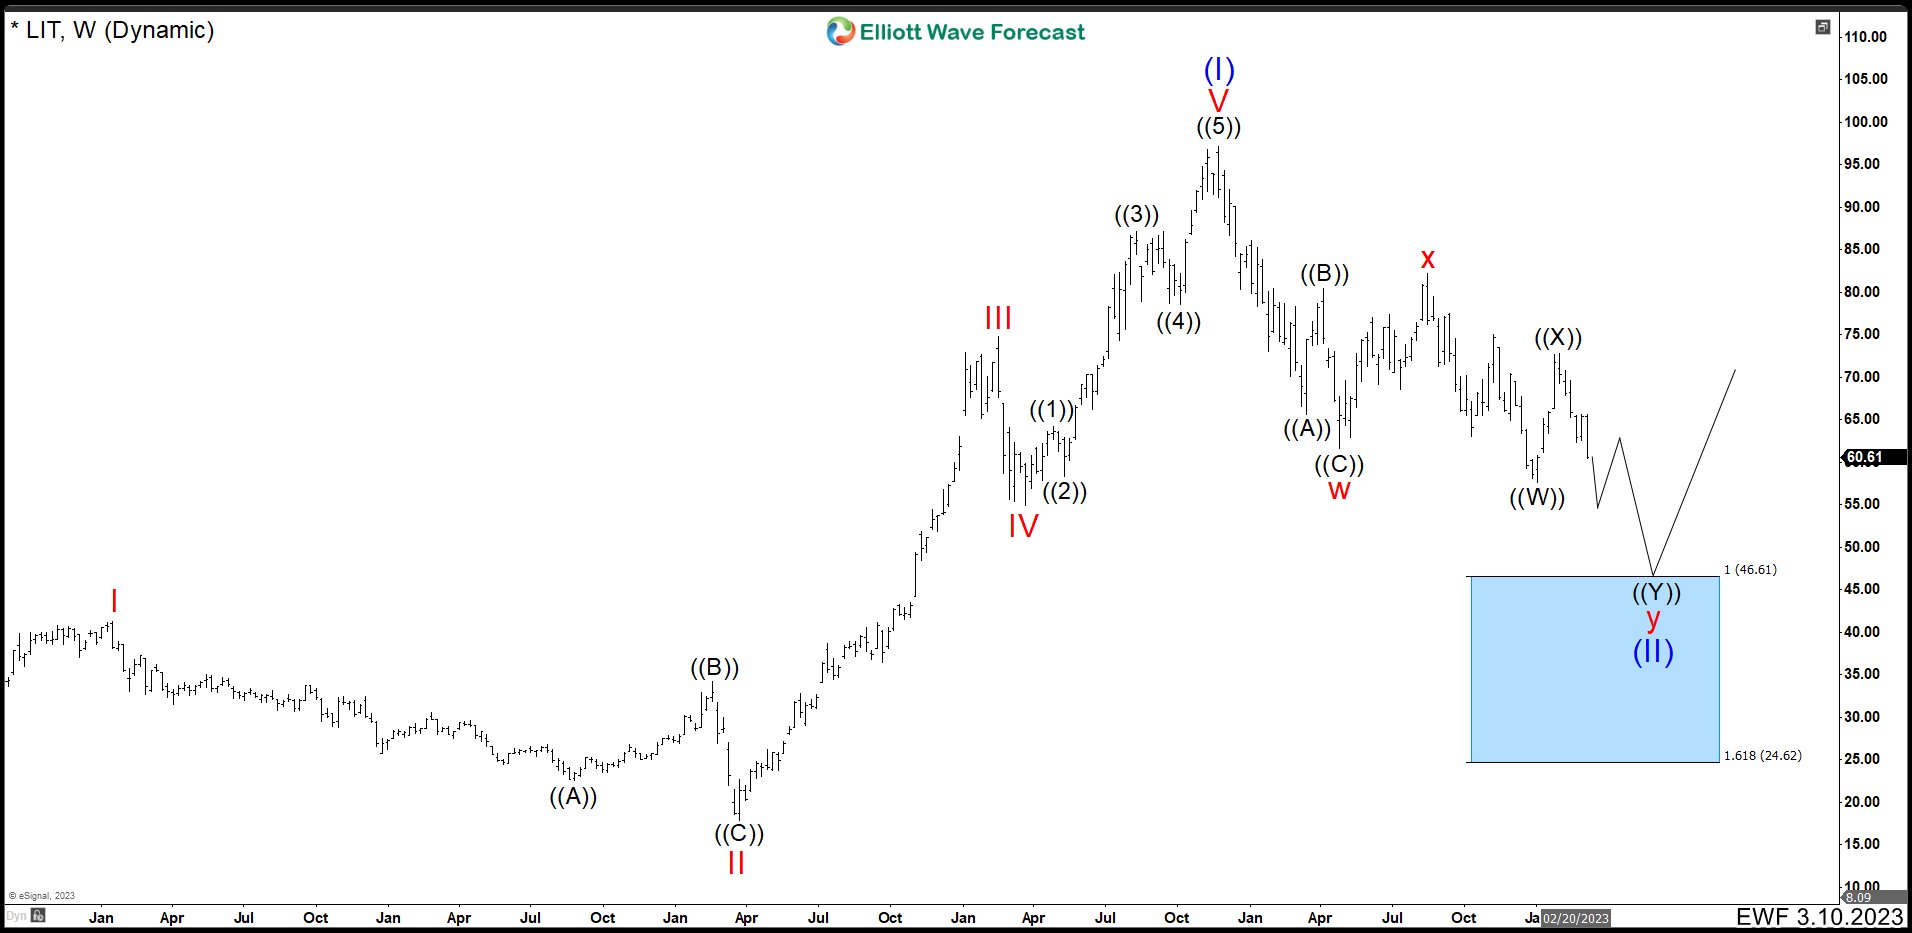
After 5 months, we can see LIT made 3 swings lower ending wave ((W)) at 57.56. This drop confirmed a bearish sequences breaking 61.50 low. The bounce completed wave ((X)) at 72.77 and continued with the downtrend. To finish the short term double correction structure ((W)), ((X)) and ((Y)), the ETF needs 3 swings lower to reach 46.61 – 24.62 area. Also this should end red wxy correction and wave (II) where it should rally to start a new uptrend.
Source: https://elliottwave-forecast.com/commodities/lithium-etf-lit-downside-blue-box/