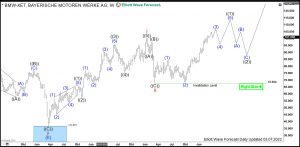
BMW is one of the biggest german car manufacturers excelling in quality and technical characteristics. Investors and traders can trade the company stock under ticker $BMW in Frankfurt at XETRA. Back in April 2020, we were calling $BMW for a new bullish cycle. We were right, the price has more than doubled. Then, in the article from June 2021, we forecasted a pullback against March 2020 lows to happen. Indeed, $BMW has retraced part of the advance. Now, from March 2022 lows, we see another bullish cycle in progress. Another extension higher has been confirmed by breaking the January 2022 highs. Here, we present an updated view on $BMW stock, discuss the Elliott Wave structure, bullish sequences and provide targets.
BMW Monthly Elliott Wave Analysis 03.08.2023
The monthly chart below shows $BMW traded at XETRA. From all-time lows, the stock price has developed an Elliott wave motive wave pattern. The cycle up in blue wave (I) being of super cycle degree has ended by printing the all-time highs on March 2015 at 123.75. Within the super cycle in wave (I), the red waves I, III and V of cycle degree are also motive waves. Moreover, wave III shows an extension.
From the March 2015 highs, a correction in wave (II) has unfolded as a double three pattern, i.e., a 7 swings structure. As correctly called in the initial article, it has printed an important bottom in March 2020 at 36.59. From there, a new cycle in blue wave (III) has started and should reach towards 123.75 highs and even higher.
BMW Weekly Elliott Wave Analysis 03.08.2023
The weekly chart below shows in more detail the initial nest consisting of red waves I-II and the advance in red wave III of blue wave (III). First, red wave I of blue wave (III) has developed an impulse towards January 2022 highs at 100.42. From there, a pullback in red wave II has found a bottom at 67.58. While above March 2022 lows, red wave III is in progress. It has been confirmed by breaking 100.42 highs. Now, we see a bullish sequence. Therefore, while above 67.58 lows, red wave III can reach 131.66-171.21 area and possibly higher.
Investors should not chase the BMW stock at current prices. Since the world indices are in a choppy market conditions, it is reasonable to wait for a pullback in the BMW stock as well. Investors and traders can be looking to buy $BMW in a pullback against 67.58 lows in 3, 7 or 11 swings targeting 131.66-171.21 area in medium term and 159.70-235.90 area in a long run.

Source: https://elliottwave-forecast.com/stock-market/bmw-bullish-sequence/
