
C3.ai (NYSE: AI) made its debut on the New York Stock Exchange on December 9, 2020, with an initial public offering (IPO) that raised $651 million. Since then, the stock has been actively traded on the NYSE, with a current market capitalization of over $10 billion. As one of the newest players in the AI industry, C3.ai is making a name for itself with its innovative and scalable AI solutions that are designed to help companies optimize their operations and decision-making processes.
The glory days for C3.ai AI were short-lived. While the stock doubled in price in its first three weeks of trading after its IPO in December 2020, it soon entered a steep decline that lasted until December 28, 2021, resulting in a 94% decrease in value. However, the excitement surrounding artificial intelligence (AI) began to build in the last quarter of 2022, particularly following the release of a groundbreaking chatbot called chatgpt. This was among several factors that contributed to the recent strong reversal of C3.ai’s stock.
In this article, we’ll examine the Elliott wave technical structure leading up to this rally and explore the potential path for the rest of the year.
C3.ai (NYSE: AI) Weekly Elliott Wave Chart
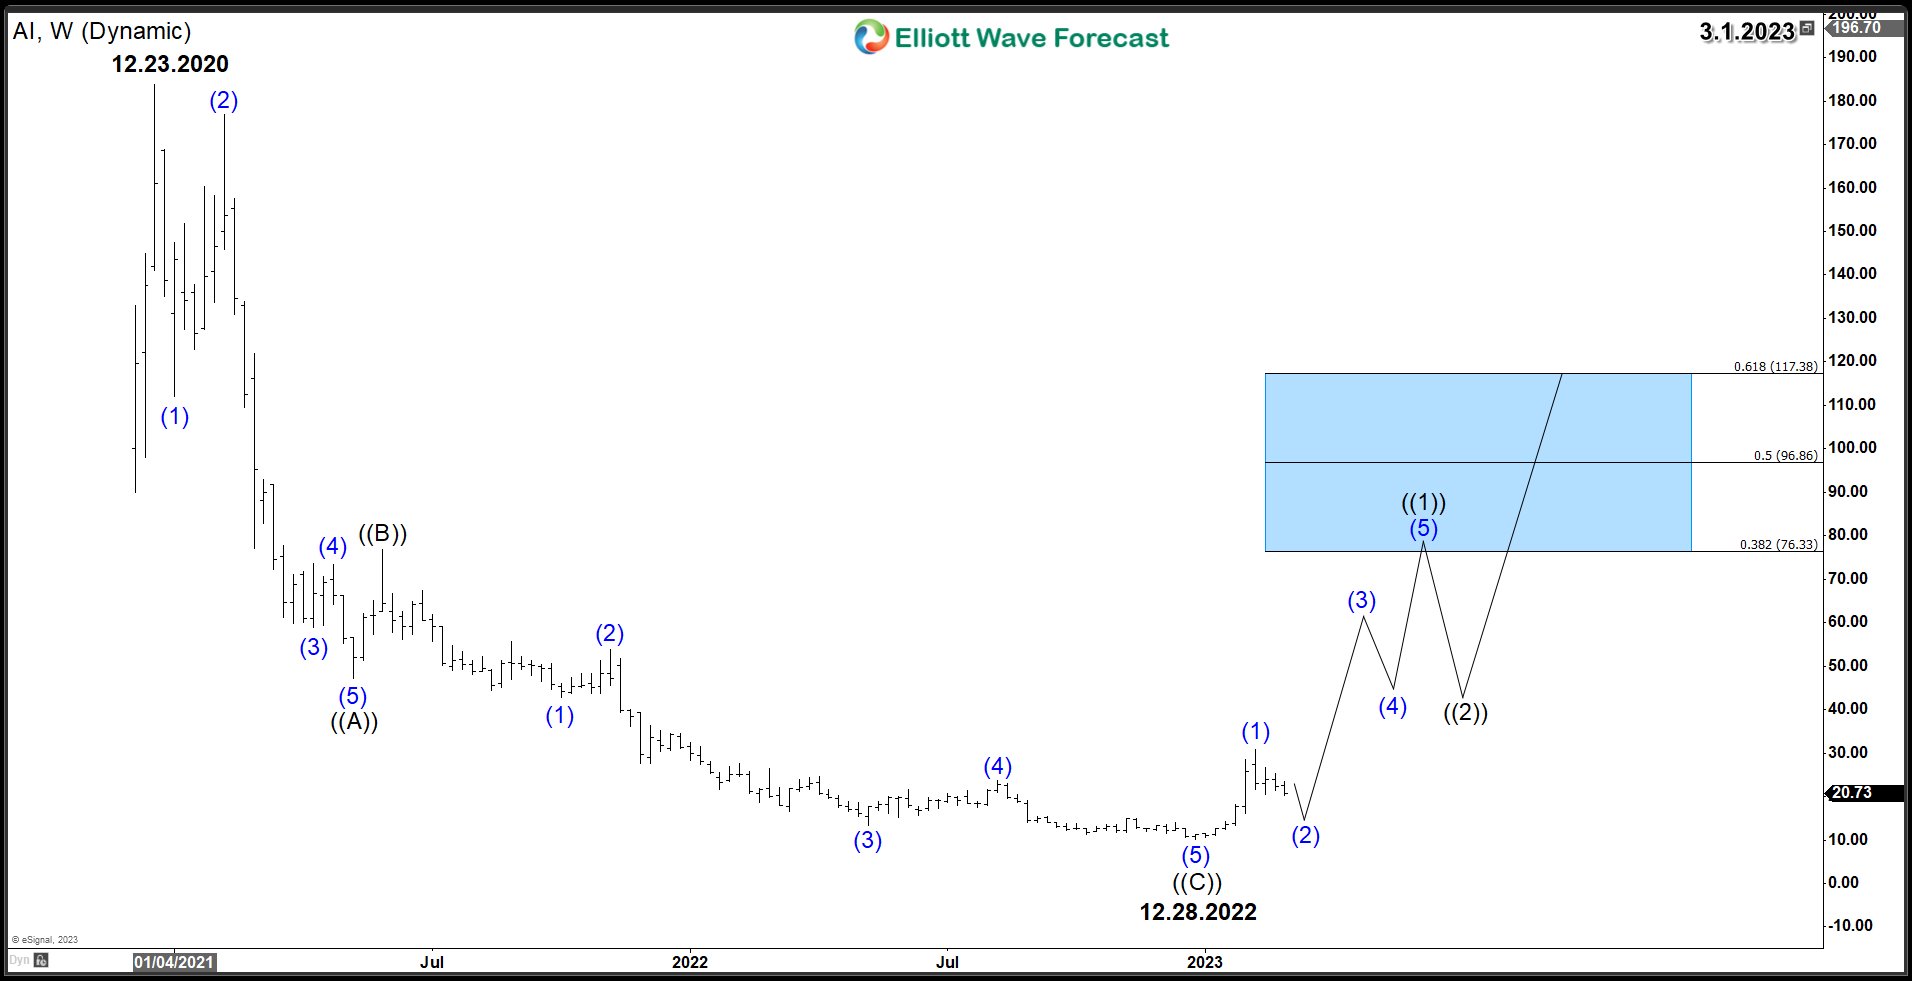
The dominant trend since the peak of 183.9 in December 2020 has been to the downside. The price action can be characterized as a Zigzag structure (A)(B)(C), which is a 3-wave corrective pattern in the Elliott Wave theory. Typically, after this type of structure completes, the price will reverse to establish a new trend or at least correct the previous cycle. The potential for a strong move to the upside with a tasty risk-reward ratio exists for investors as the bounce could potentially reach the 38.2% – 61.8% Fibonacci retracement area, which is around $76 – $117.5. The stock cannot start the next upside move until the current pullback in wave (2) holds above the lows. As the price action develops in the coming weeks, we will have more data to confirm or deny the potential move.
C3.ai (NYSE: AI) 4 Hour Elliott Wave Chart

The 4H chart below provides a detailed view of the remarkable 200% rally from the low of $10.16. The stock’s impulsive wave (1) peaked at $30.92, followed by an Elliott wave corrective move in wave (2). In the previous month, the stock underwent an initial 3 swings pullback into the 50% Fibonacci retracement level at 20.57, where wave W ended, then rebounded in wave X. However, the stock made a new marginal low today, indicating an incomplete bearish sequence from the wave (1) peak, suggesting that the correction may continue lower as a Double Three structure within wave (2), targeting the equal legs area of $16 – $13. If the price holds above the $10.16 level of , AI may experience another rally later in the year, following the new trend established earlier in January. However, the daily price action needs to be closely monitored to confirm any potential upward movement.
Source: https://elliottwave-forecast.com/video-blog/c3-ai-disrupting-tech-industry/