
Microsoft Corporation is an American multinational technology corporation producing computer software, consumer electronics, personal computers, and related services headquartered at the Microsoft Redmond campus located in Redmond, Washington and listed on NASDAQ stock exchange with the ticker symbol (MSFT).
The series of rate hikes by the Fed has provided a challenge for the World Indices and individual stocks. Stock markets kept making a lower lows since they formed the peak in 2021. We saw a strong reaction higher after the low seen at the end of October or early November 2022 and many started to believe that correction is over and a new wave of bull market has started. However, in this blog, we will look at incomplete Elliott Wave Sequence in Microsoft which negates the view that correction is over at least in the tech stocks and related Indices / ETFs.
Microsoft (MSFT) Daily Elliott Wave Chart
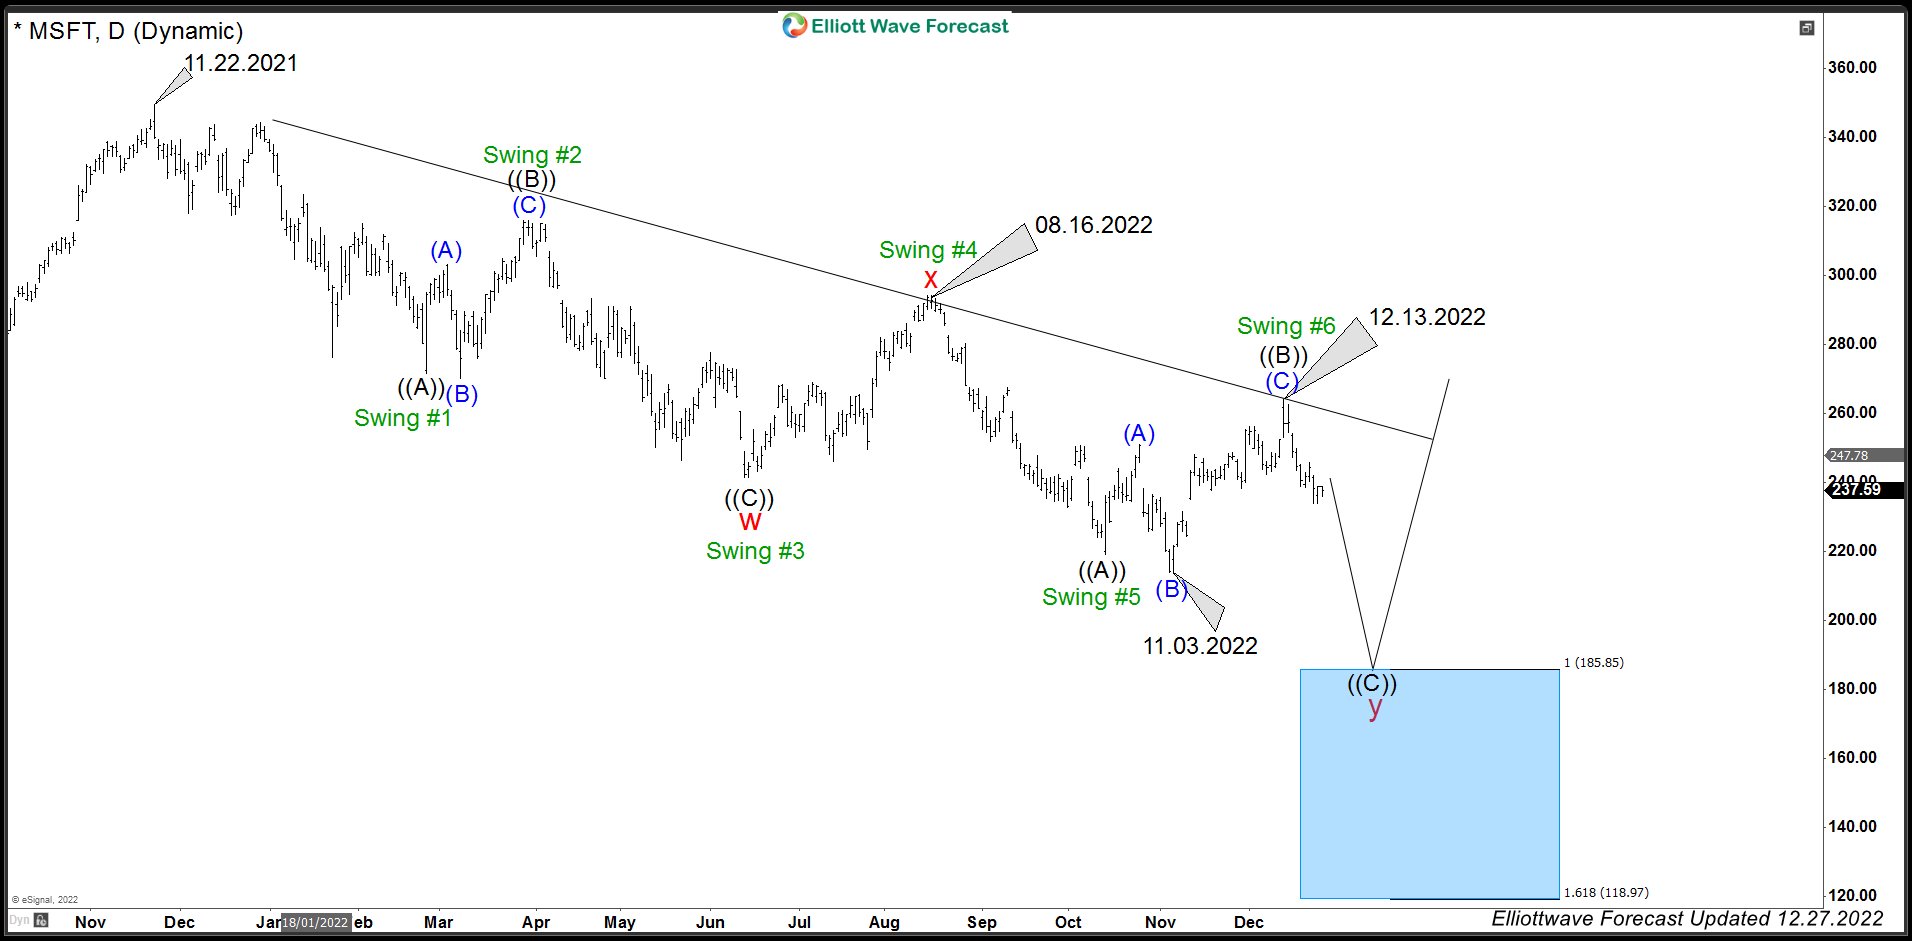
Daily Chart of MSFT (NASDAQ) shows that it has a bearish sequence from 11.22.2021 high. Structure of the decline is in a double three Elliott Wave structure. Down from 11.22.2021 high, wave ((A)) ended at 271.52 and wave ((B)) corrective bounce ended at 315.95. The stock then extended lower in wave ((C)) towards 241.51 which also completed cycle degree wave “w”. Wave “x” bounce ended at 294.18 and the stock has resumed lower. Wave “y” is now in progress and with a new low below wave “w”, there are now 5 swing down from the peak at 11.22.2021 and this makes it an incomplete sequence and calls for more downside towards 100% – 123.6% (185.85 – 118.97) area to complete 7 swing sequence. This is where buyers are expected to appear for a new leg higher or 3 waves rally at least.
Source: https://elliottwave-forecast.com/stock-market/microsoft-elliott-wave-sequence-lower/