Infineon Technologies AG is a German semiconductor manufacturing corporation. It has been founded 1999 as a spin-off from Siemens AG and the headquarteres of the company are in Neubiberg, Germany. Today, Infineon belongs to the DAX index and one can trade it under the ticker $IFX at Frankfurt Stock Exchange. The company is the world leader in automotive and power semiconductors. Worldwide, Infineon counts more than 50’000 employees.
In the initial article from April 2021, we have called for an extension higher within cycle from March 2020 lows. Since then, the market has advanced from €35.60 to €43.845. Now, the stock price is correcting that cycle providing an opportunity to enter again at low price. Here, we provide an update.
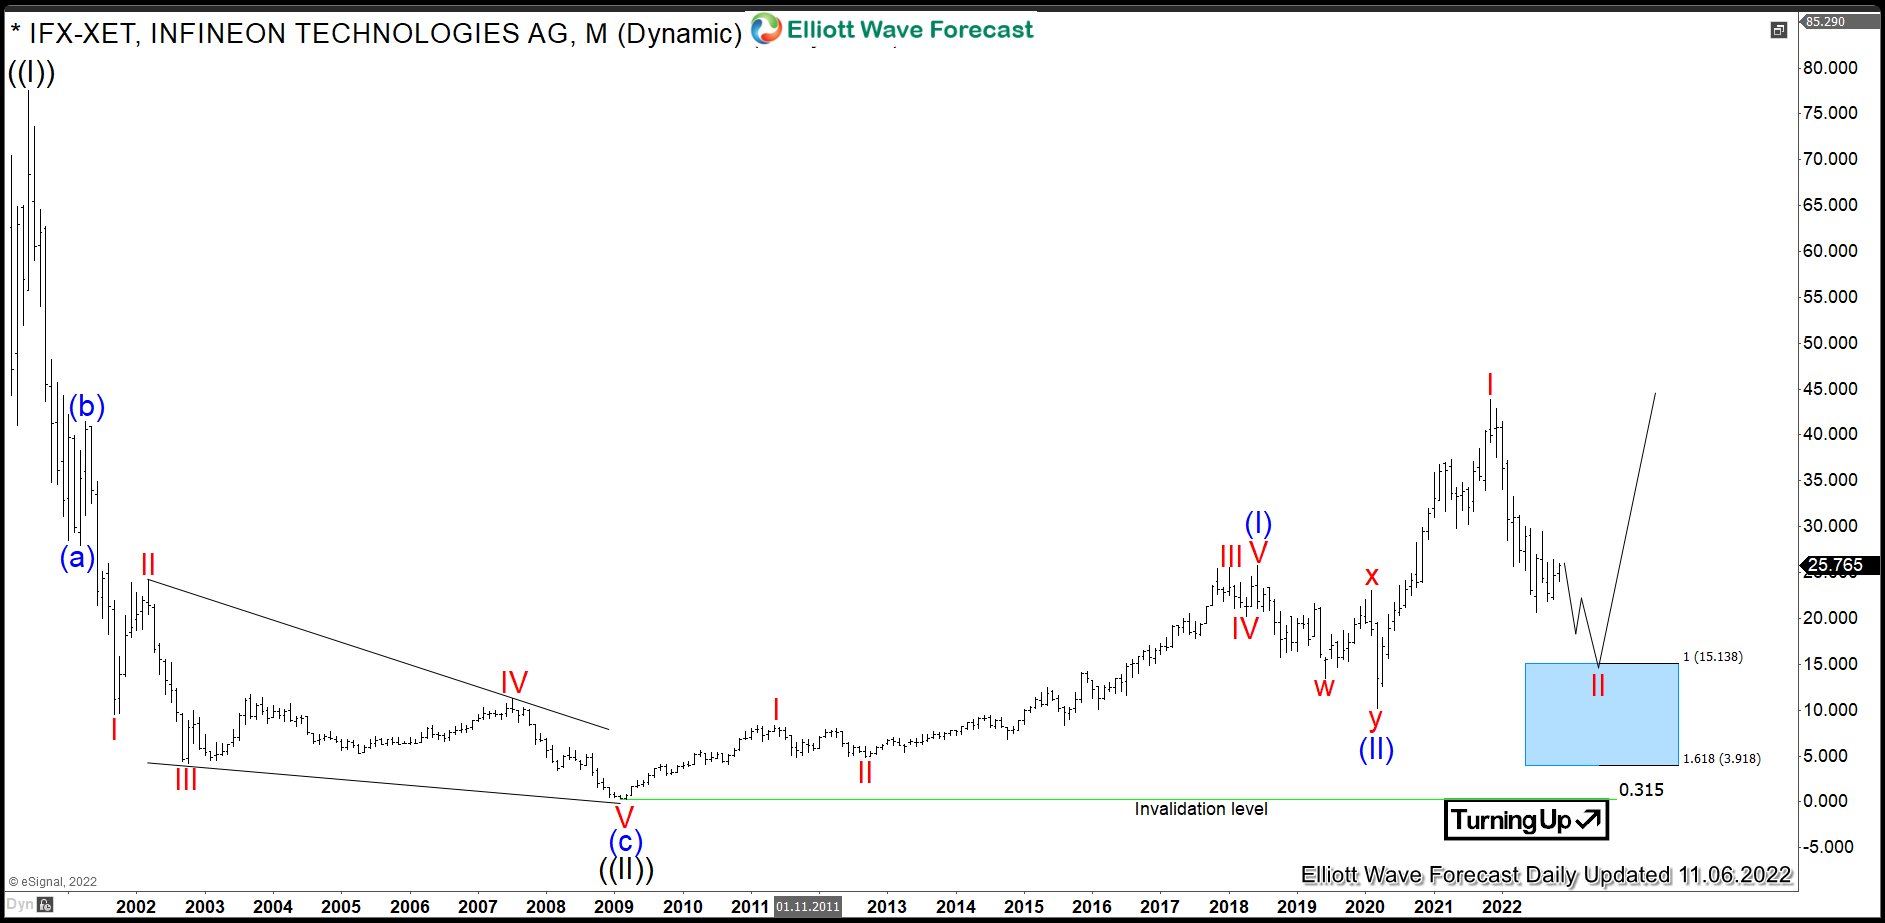
Infineon Monthly Elliott Wave Analysis 11.06.2022
The monthly chart below shows the Infineon shares $IFX traded at Frankfurt Stock Exchange. From the all-time lows, the stock price has developed a cycle higher in wave ((I)) towards the 77.57 highs. There, in June 2000, it has printed the all-time highs. After the primary impulse higher, a correction lower in wave ((II)) has ended on March 2009 at 0.315.
From the March 2009 lows, a new cycle in wave ((III)) has started and develops a series of nests. First of all, a cycle higher as a blue wave (I) has ended in June 2018 at 25.76. Hereby, within the impulsive advance, all the subwaves I, III and V are impulsive waves, too. Wave III demonstrates a clear extension in price. From the June 2018 highs, a correction in wave (II) lower has unfolded as a double three pattern. It has printed the low in March 2020 at 10.13.
From the March 2020 lows, a new cycle in wave (III) of ((III)) has already started. As a matter of fact, break of 25.76 has confirmed that. In November 2021, the price has ended wave I at 43.845. Now, it is setting back in red wave II of blue wave (III). It is expected to find support above 10.13 lows in 7 or 11 swings. Then, acceleration higher in red wave III should take place.
In case of a reaching deeper into the box and breaking below 10.13 pivot, then alternative wave count will be applied whereby the reaction higher will become red wave I of blue (III).
Infineon Daily Elliott Wave Analysis 11.06.2022
The Daily chart below shows the $IFX shares price consolidation from November 2021 highs in more detail. Firstly, black wave ((W)) has ended in March 2022 at 25.69 lows. Then, a bounce in black wave ((X)) has set a connector the same month at the 33.26 highs. Finally, black wave ((Y)) has broken the 25.69 lows opening up a bearish sequence. Now, the price should continue lower towards 15.14 and lower.
Investors and traders can be looking to buy $IFX from 15.14-3.91 area targeting the €43.845 highs and above in medium term and 77.97-125.94 area in a longer view.

Source: https://elliottwave-forecast.com/stock-market/infineon-opportunity-pullback/