
In this technical blog, we will look at the past performance of 1-hour Elliott Wave Charts of USDCAD. In which, the rally from 11 August 2022 high is unfolding as an impulse sequence and showed a higher high sequence. Therefore, we knew that the structure in USDCAD is incomplete to the upside & should see more upside. So, we advised members to buy the dip in 3, 7, or 11 swings at the extreme areas. We will explain the structure & forecast below:
USDCAD 1-Hour Elliott Wave Chart
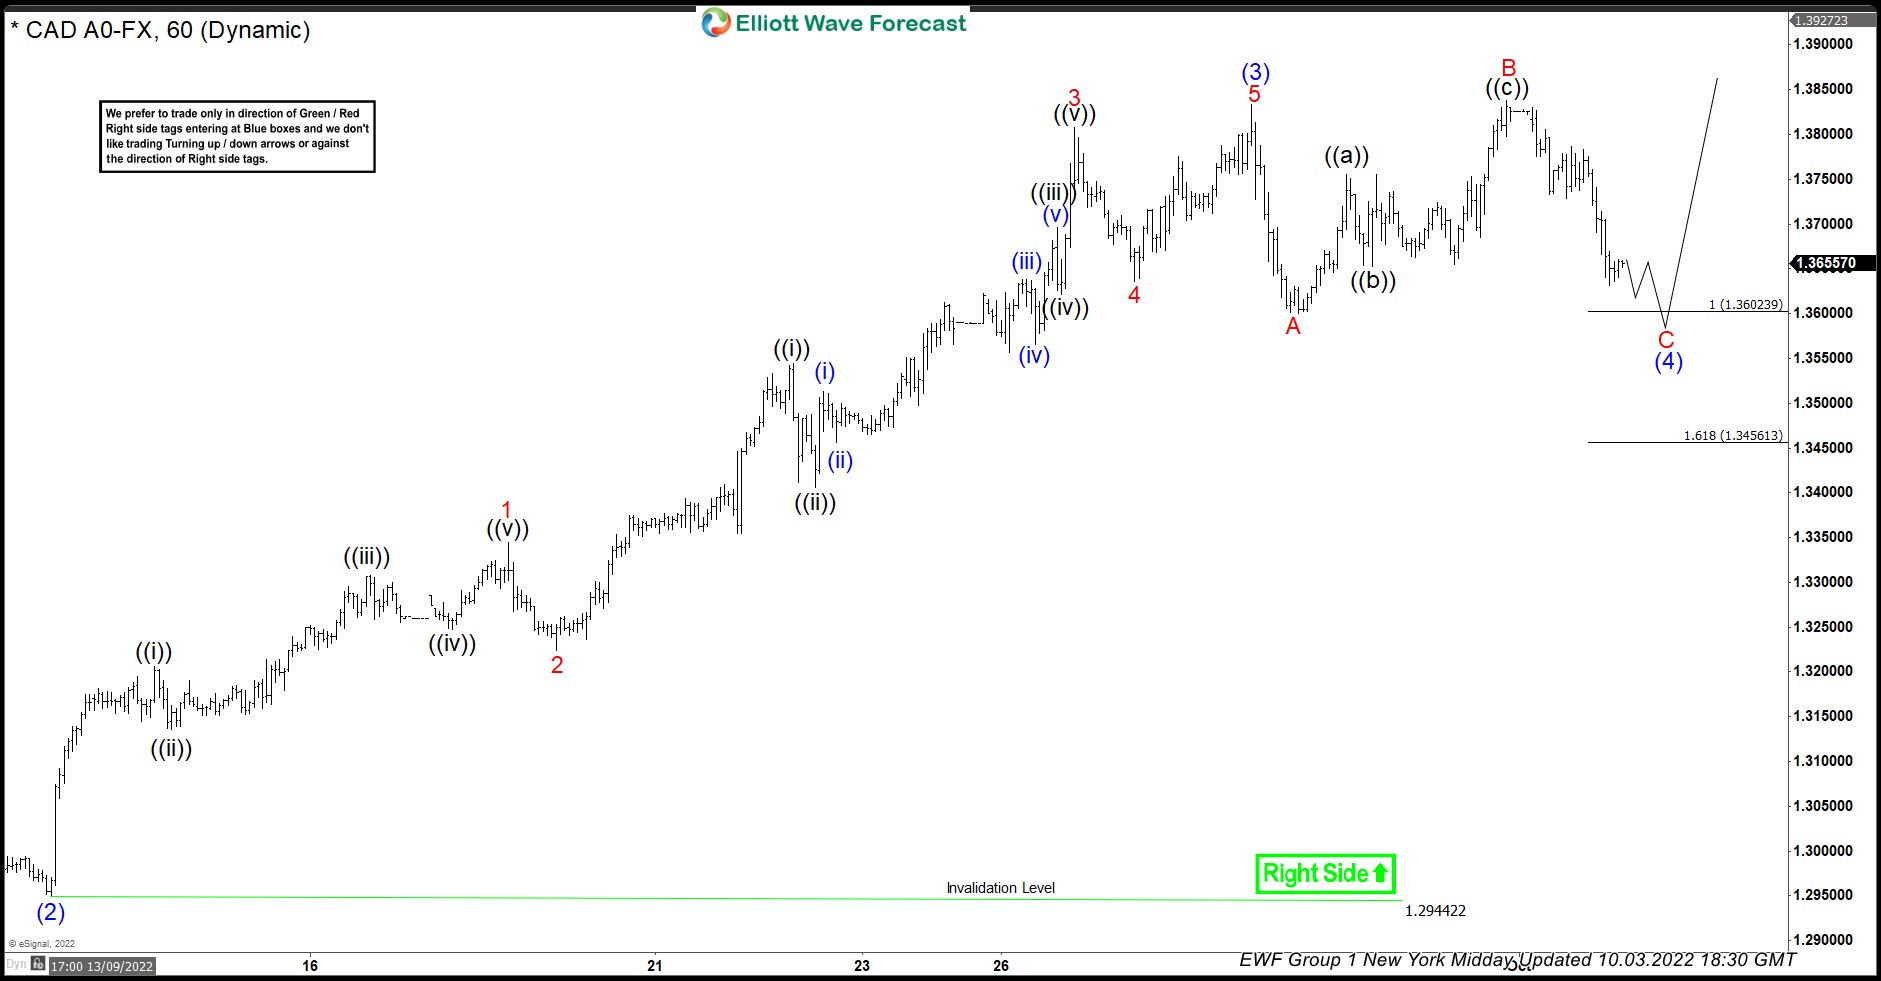
Here’s the Elliott wave Chart from the 10/03/2022 New York Midday update. In which, the rally to $1.3833 high ended the cycle from the 13 September 2022 low in wave (3) & made a pullback in wave (4). The internals of that pullback unfolded as Elliott wave flat structure where wave A ended at $1.3600 low. Then a bounce to $1.3838 high ended wave B & started the next leg lower in wave C towards $1.3602- $1.3456 equal legs area. From there, buyers were expected to appear looking for new highs ideally or for a 3 wave bounce minimum.
USDCAD Latest 1-Hour Elliott Wave Chart
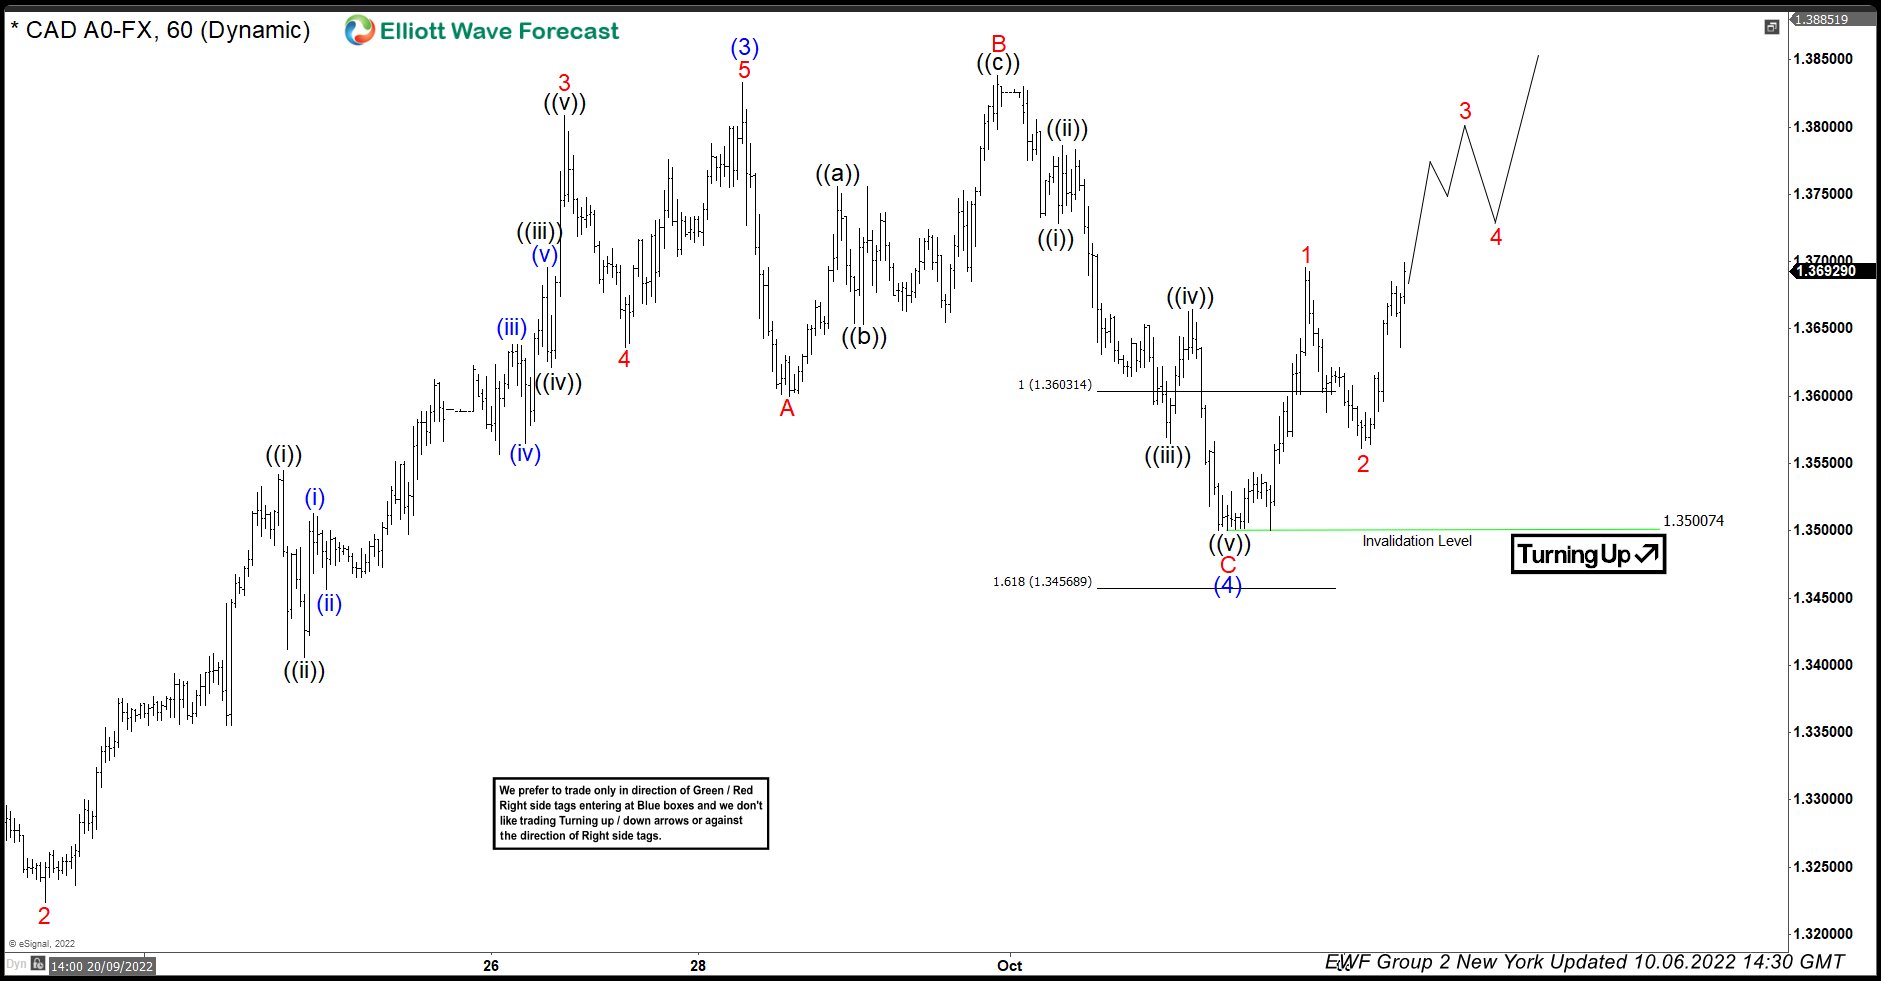
Above is the latest Elliott wave Chart from the 10/06/2022 New York update. In which the pair is showing a reaction higher taking place from the equal legs area. Right after ending the flat correction. Allowed members to create a risk-free position with the minimum reaction higher towards 50%- 61.8% Fibonacci retracement from the wave B peak at $1.3669- $1.3709 area. However, a break above $1.3838 high is still needed to confirm the next extension higher & avoid a double correction lower.
Source: https://elliottwave-forecast.com/forex/usdcad-reacting-higher-equal-legs-area/